India's new GDP measurement explained
In today’s Finshots, we break down India’s revised GDP estimates, the new measurement framework, and the hows and whys behind it.
But before we begin, if you’re someone who loves to keep tabs on what’s happening in the world of business and finance, then hit subscribe if you haven’t already. If you’re already a subscriber or you’re reading this on the app, you can just go ahead and read the story.
The Story
If you’ve read Finshots long enough, you’ve come across the term GDP (Gross Domestic Product) more times than you can count. So you already know that GDP is simply the total value of goods and services a country produces over a given period. It’s the most widely used indicator of an economy’s size and overall health. Once you have this figure, you can broadly assess whether an economy is expanding or contracting, draw inferences about living standards, and even compare it with other countries.
Right now, India’s nominal GDP, also called GDP at current prices, for FY26 is estimated at ₹345 lakh crore. For the uninitiated, nominal GDP is the value of all goods and services measured using the prices that actually prevailed in that year. It rises either because we’ve produced more, or prices have gone up (inflation).
But here’s the thing. In the latest Economic Survey released at the end of January, the government had pegged India’s nominal GDP at ₹357 lakh crore.
So in barely a month, the estimate appears to have dropped by roughly 3%.
On the surface, that sounds alarming. But that’s not really what has happened. Nor has the government made a mistake in calculating the figures. The difference exists because, just a few days ago, the government changed the way it calculates GDP by introducing a new framework.
And to understand why the number looks different today, we first need to understand how GDP is calculated.
So let’s take it from the top. GDP is simply calculated by multiplying the quantities of goods and services produced in a year by their prices. But the moment you do that, one question pops up: which prices should you use?
That’s where GDP splits into two types.
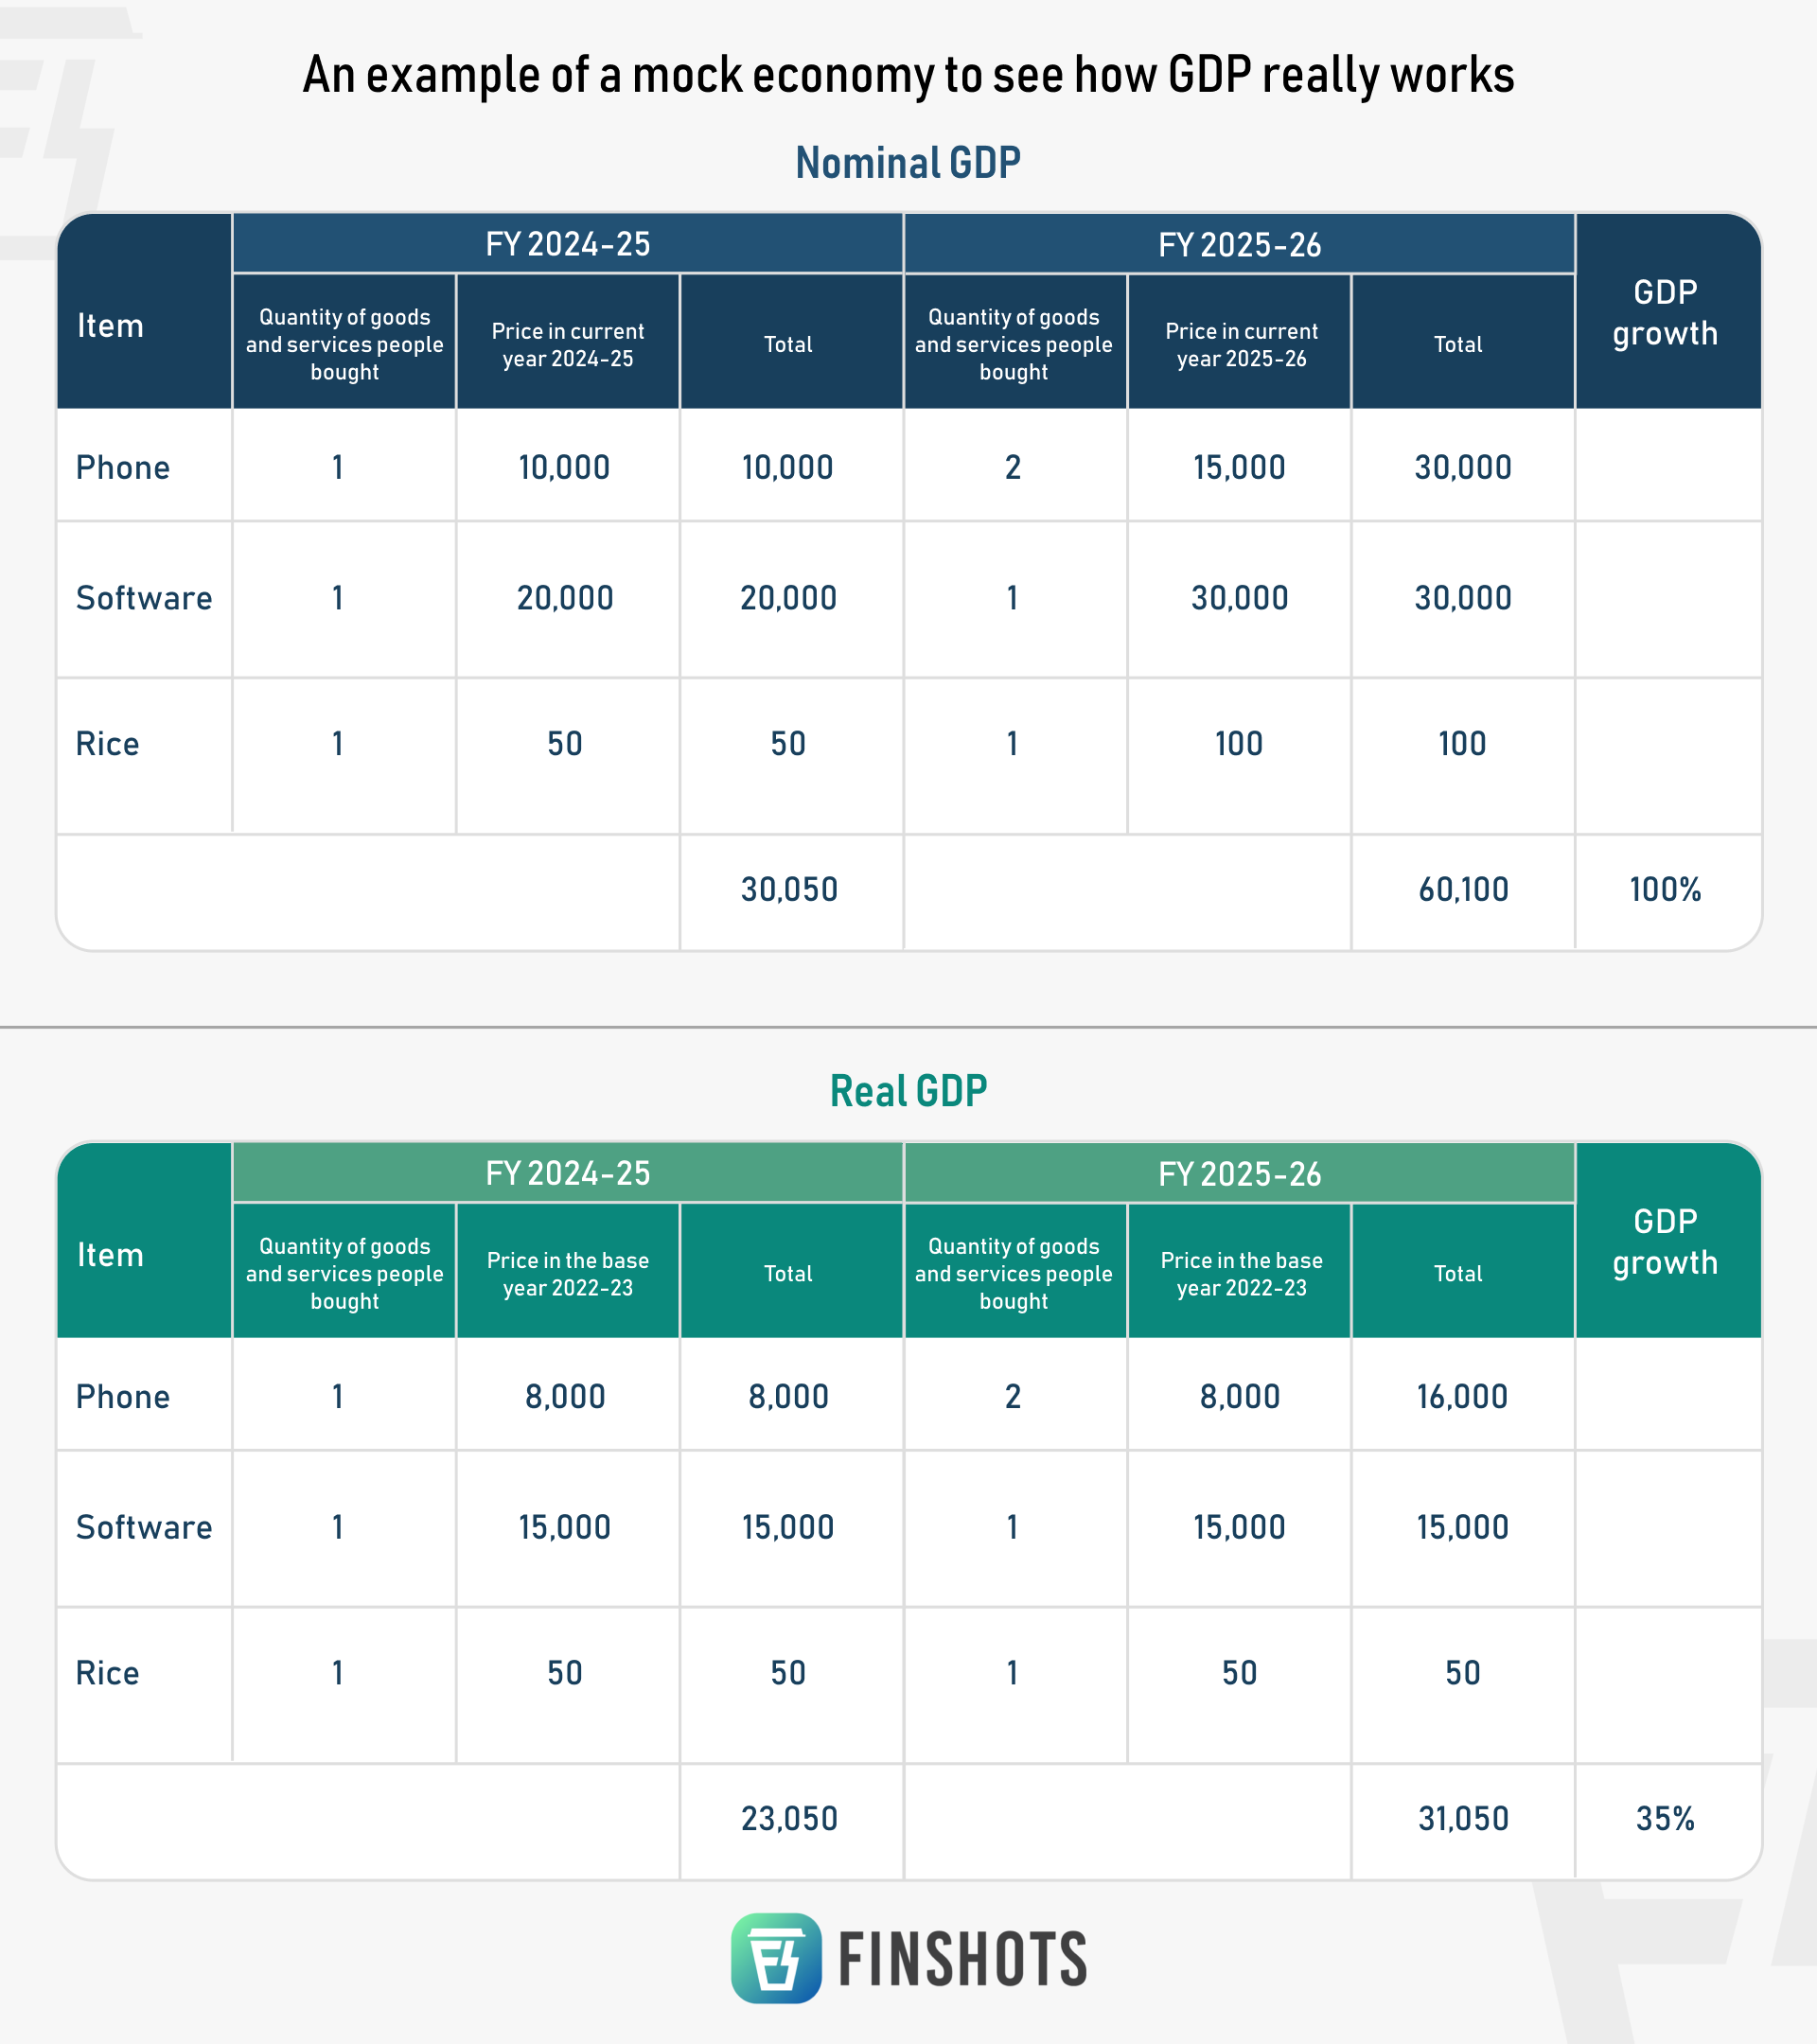
First, nominal GDP, which we’ve already spoken about. Here, you take the quantities produced in, say, FY25 and multiply them by the prices in that same year. So imagine that in FY25, hypothetically of course, people in India buy 1 phone at ₹10,000, 1 software licence at ₹20,000 and 1 kg of rice at ₹50. The total nominal GDP would be ₹30,050. Now in FY26, suppose people buy 2 phones at ₹15,000 each, 1 software licence at ₹30,000 and 1 kg of rice at ₹100. Nominal GDP jumps to ₹60,100.
Clearly, GDP has increased. But it’s not just because people bought more. Prices also went up. So you can’t say that the economy truly doubled. To compare output properly, you need to remove the effect of inflation.
That’s where real GDP or GDP at constant prices, comes in. Here, you pick a base year and use its prices as a fixed reference point. Suppose 2022-23 is the base year, with prices of ₹8,000 per phone, ₹15,000 per software licence and ₹50 per kg of rice. Using those prices, real GDP in FY25 would be ₹23,050 and in FY26 ₹31,050.
Phew! That was a lot of calculations. But you get the point. And it’s important you do, because these very concepts are what explain why our FY26 nominal GDP estimate now looks more modest than before.
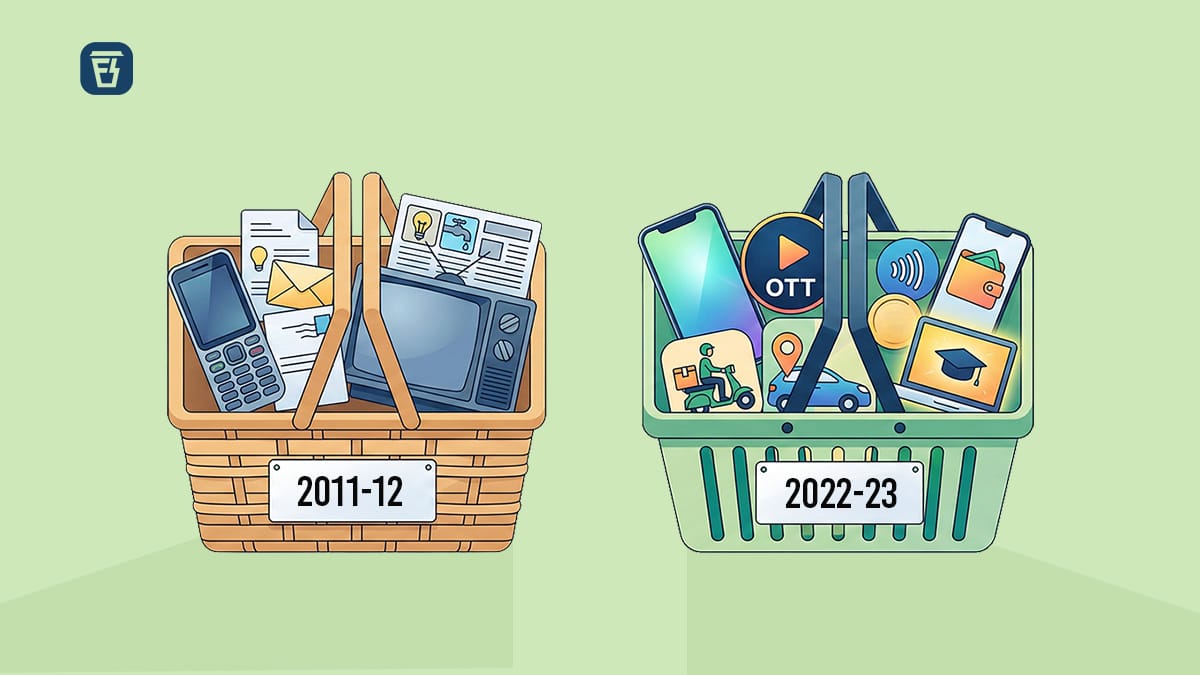
The government and India’s statisticians have just rolled out a new GDP framework. They’ve shifted the base year from 2011–12 to 2022–23 and updated a few methods along the way. In plain language, they’ve changed the ruler with which we measure the economy.
Which naturally makes you ask: why change the GDP framework at all?
Well, it’s just like the clothes in your wardrobe. Some of them may still fit, but you don’t wear them anymore because they no longer match your current lifestyle or the trend. So after a point, you swap them out either by donating them, recycling them, or simply turning them into a pochha (the Hindi word for a duster or mop), and replace them with something more relevant.
India’s old GDP base year, 2011–12, had a similar problem.
Back in 2011–12, UPI didn’t exist. The startup and platform ecosystem was tiny. We had VAT (Value Added Tax) instead of GST (Goods and Services Tax). And digital services and gig work were nowhere near today’s scale.
Yet, until now, we were using 2011–12 prices and the economic structure of that time as the benchmark to measure “real” GDP. In other words, we were valuing today’s very different economy using yesterday’s price patterns.
So the government said, “Hey, let’s pick a newer base year that better reflects the present structure of the economy.” And it chose 2022–23 because it represents the most recent “normal” year after the pandemic disruptions of 2019–20 and 2020–21.
But that’s not the only thing. The old framework also leaned heavily on proxies and extrapolations. Back when 2011–12 was the base year, there wasn’t timely data from small firms or clear visibility into informal activity and newer services. So statisticians often had to rely on older surveys or limited samples to fill the gaps.
Today, that’s no longer the case. We now have GST filings, corporate balance sheets, digital transaction footprints and updated surveys. Naturally, the old framework had started to drift away from what was actually happening on the ground. So the base year had to change.
But changing the base year alone isn’t enough when the economy itself has evolved so much. That’s why the government updated some methods too.
One technical but important upgrade is better handling of inflation.
You see, to move from nominal GDP to real GDP, statisticians use something called deflators. Because as you already know, when GDP rises, part of that increase may simply be higher prices, not higher output.
A deflator helps separate the two. It essentially asks, “Did we actually produce more, or did things just get more expensive?”
So now, instead of broad adjustments that they used to make earlier, they use over 260 specific CPI (Consumer Price Index or a metric that tracks inflation) price indices covering items like diesel, doctor fees, software licences, etc. to adjust for inflation more precisely. Because if you underestimate inflation, real growth is automatically overstated. And that’s not what we want.
Then there’s something called double deflation. Earlier, in many sectors, statisticians used a lazy old method called single deflation. That meant they adjusted either output prices (the value of what companies produced) or input prices (the cost of what they used to produce it), but not both properly. Double deflation changes that and adjusts both, giving a cleaner measure of real value added, especially in manufacturing and agriculture.
Next comes Supply and Use Tables (SUT). When we gave you that hypothetical example earlier, we spoke about people in a mock economy buying a couple of phones, some software and rice. But India’s real economy is massive. While calculating GDP, statisticians essentially sit with giant spreadsheets where they must match what’s produced with what’s spent, plus exports minus imports. If businesses say they produced ₹100 worth of goods, someone somewhere must have bought ₹100 worth.
But under the earlier framework, these two sides didn’t always match perfectly and small gaps would appear. The SUT system forces production and spending to line up properly. Think of it as a detailed ledger that pulls in data from surveys, GST and corporate filings, and adjusts things until the books balance. If supply doesn’t match spending, the system digs through the data to find the most plausible reason — maybe imports were underreported, and corrects it.
And finally, there’s private consumption — essentially household spending. The new method combines updated household surveys, production and administrative data and the commodity flow approach, which tracks goods from production to final use. It also adopts the updated COICOP 2018 classification, an international system that groups household spending into finer categories, helping India align better with global standards.
And that, folks, is exactly why our current nominal GDP estimate for FY26 is lower than it was earlier.
Sure, it may look like the economy has shrunk. But a better way to see it is that we’ve stopped flattering ourselves with slightly inflated numbers. We now have a more realistic starting point, which actually helps us understand what needs to be done if we want to become the world’s fourth-largest economy.
Now before you jump in and say, “But India is already the fourth largest economy”, hear us out. We know some of our earlier stories mentioned that too. But that was based on the previous GDP framework, under which India was expected to overtake Japan in FY26 (the year ending March 2026). But with the updated methodology, India will remain the fifth-largest economy for now and may take a few more years to surpass Japan.
That said, we still have a clear trajectory. Despite all the negative stuff that’s happening in the world, India is expected to remain one of the fastest-growing economies, with real GDP projected to grow at 7.6% in FY26. That’s higher than FY25’s 7.1%, even under the new framework. Japan, meanwhile, is projected to grow at just around 1%, and its population is shrinking, unlike India’s young and expanding demographic profile. So it may not take too long to sprint ahead.
But yeah, that’s based only on the current situation. And given the geopolitical tensions in the world right now, we’ll have to wait and see which projections hold up and which ones don’t. At the very least, we can take comfort in the fact that India is now measuring its economy in a way that is closer to reality.
Until next time…
If this story helped you understand the A to Z of GDP and its new calculation framework, please tell your friends, family or even strangers about us on WhatsApp, LinkedIn and X. Because sharing is caring.
Do you really think Corporate Health Insurance is enough to protect you?
Think again. Most corporate plans typically cover ₹3-5 lakhs. That’s way below the expert-recommended cover of ₹10 lakhs or more. Just imagine. One medical emergency, and that cover can vanish in a single hospital bill.
Moreover, once you leave your job, the policy ends too. And if you wait till then to buy a personal plan, the premium would have skyrocketed, or you could face rejection due to pre-existing conditions.
That’s why it’s smart to have personal health insurance with good coverage to fall back on.
Unsure where to begin? Ditto’s IRDAI-Certified advisors have got your back. Book a FREE 30-minute consultation today and find the right plan.
PS: Ditto is rated 4.9 on Google, with over 13,000 reviews!