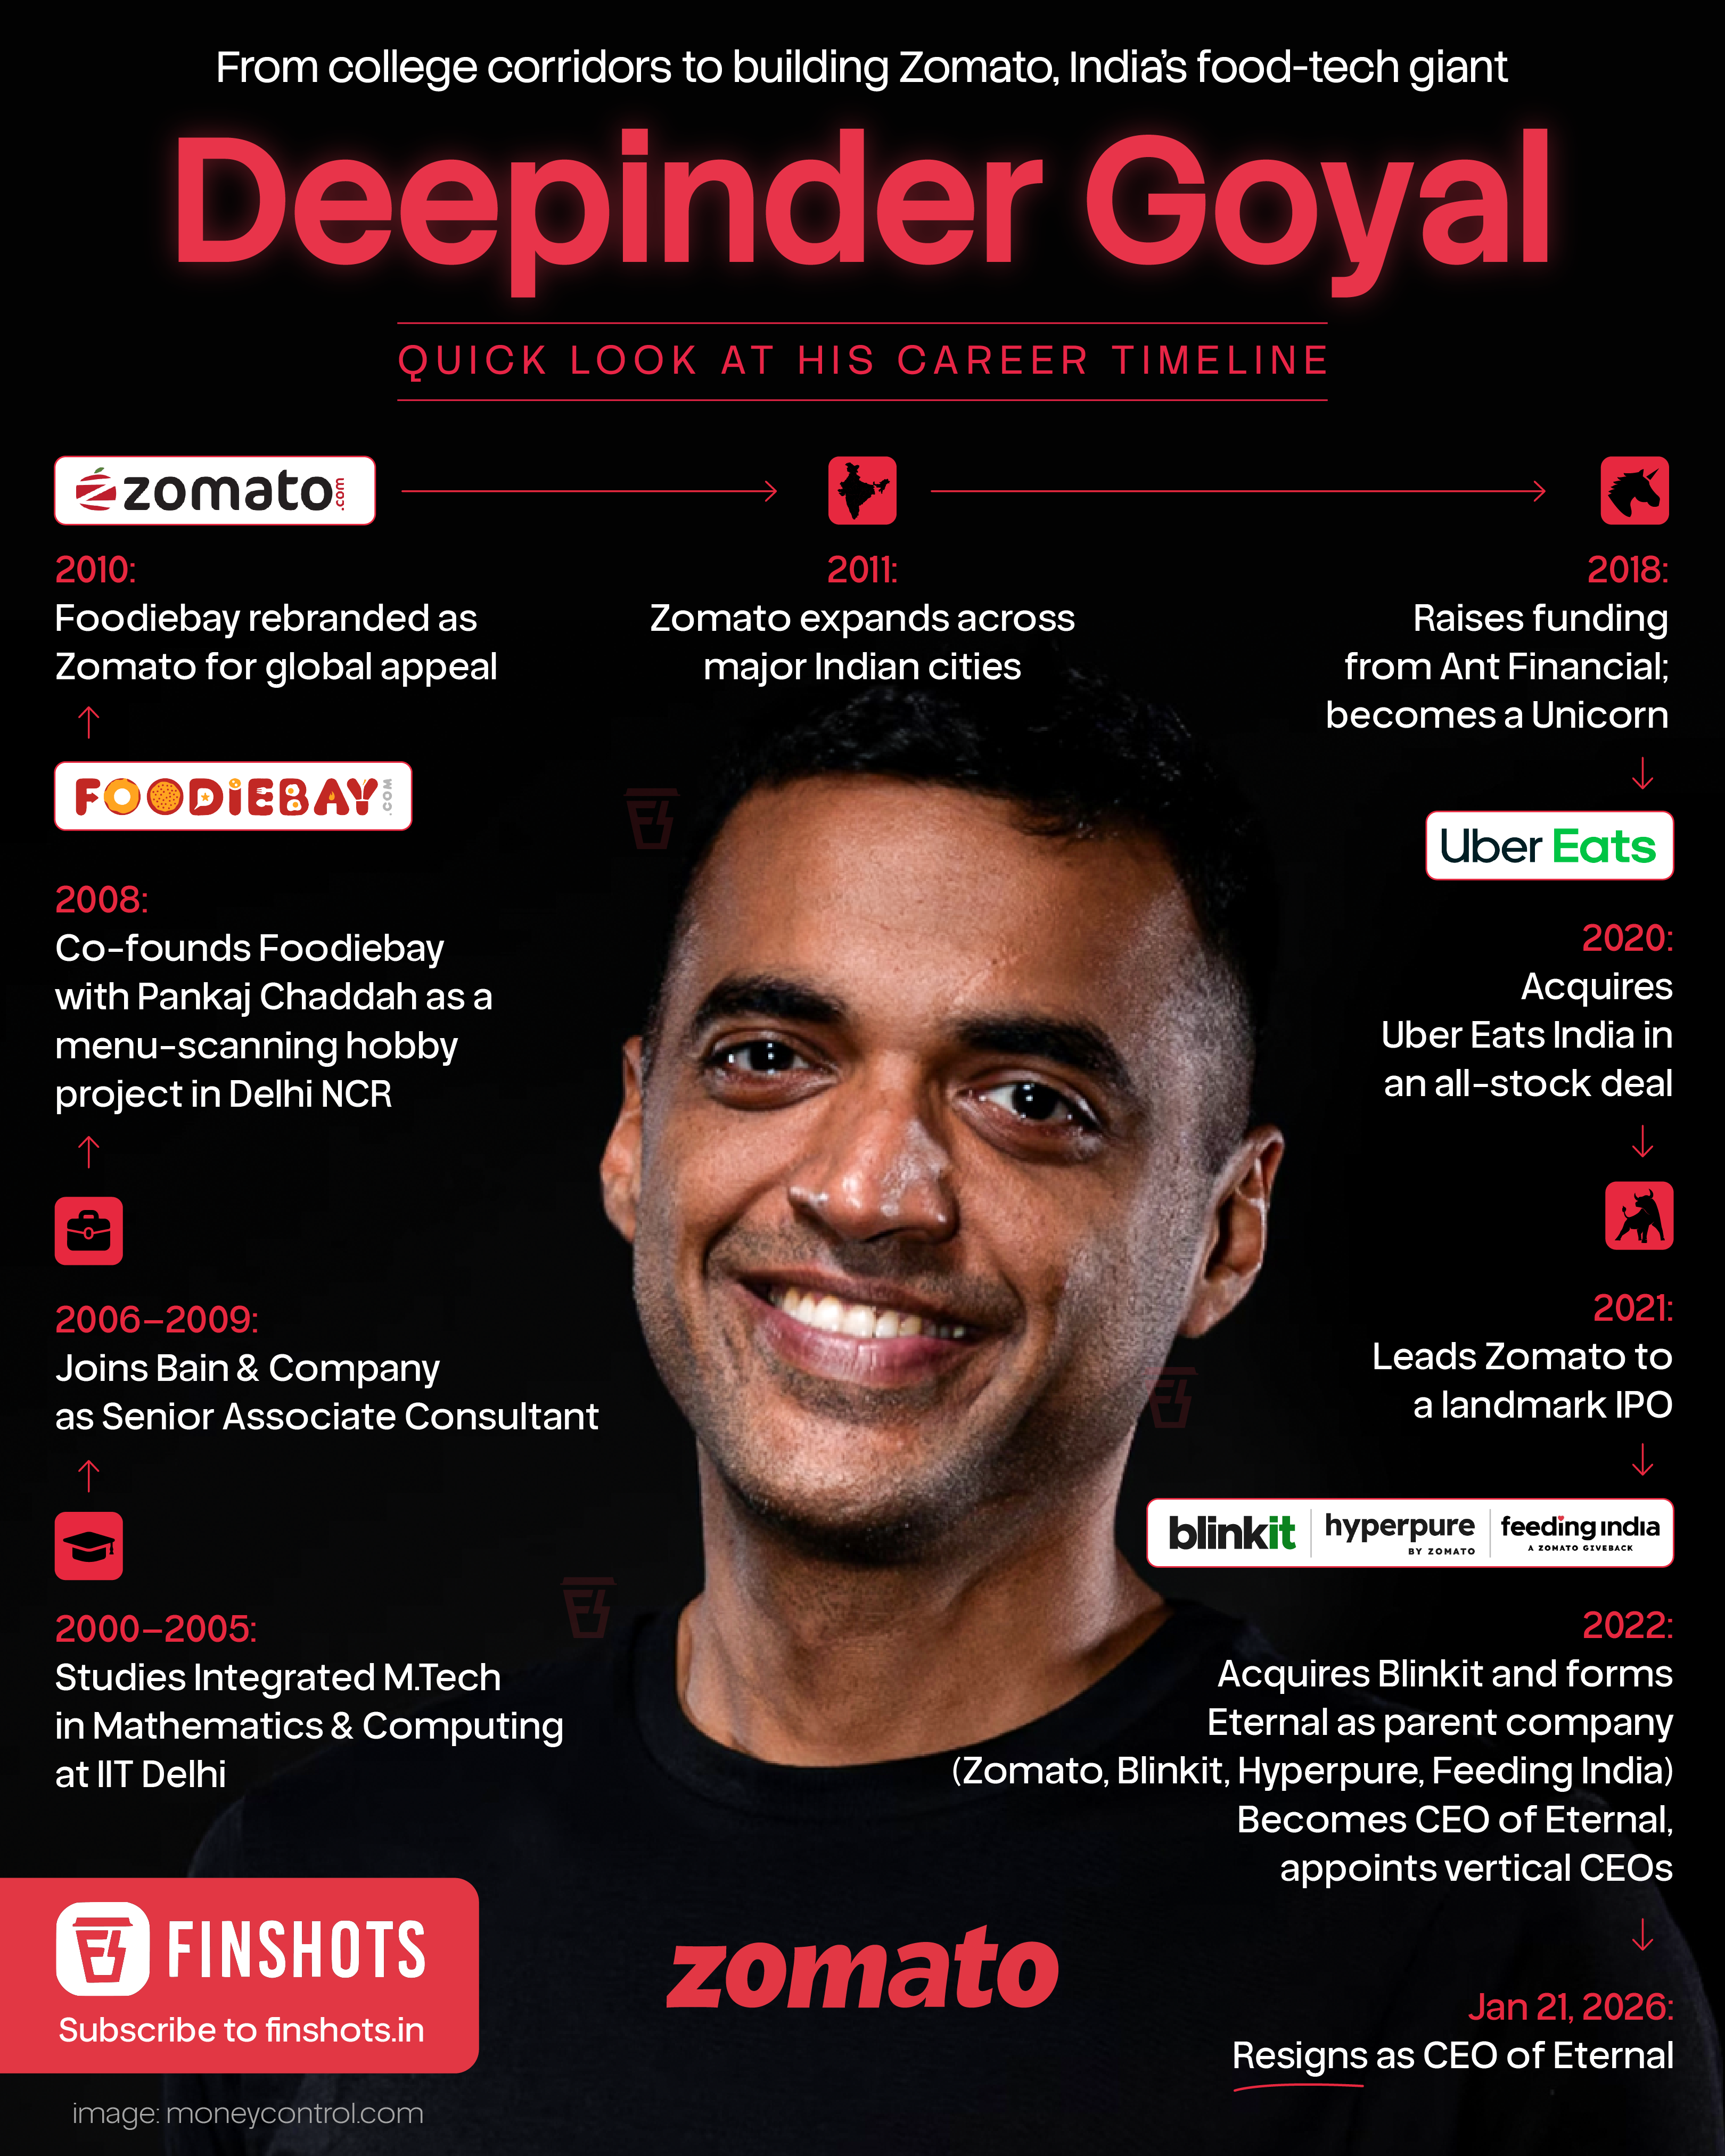
infographic Everything you need to know about Deepinder Goyal A look at Deepinder Goyal's career timeline.
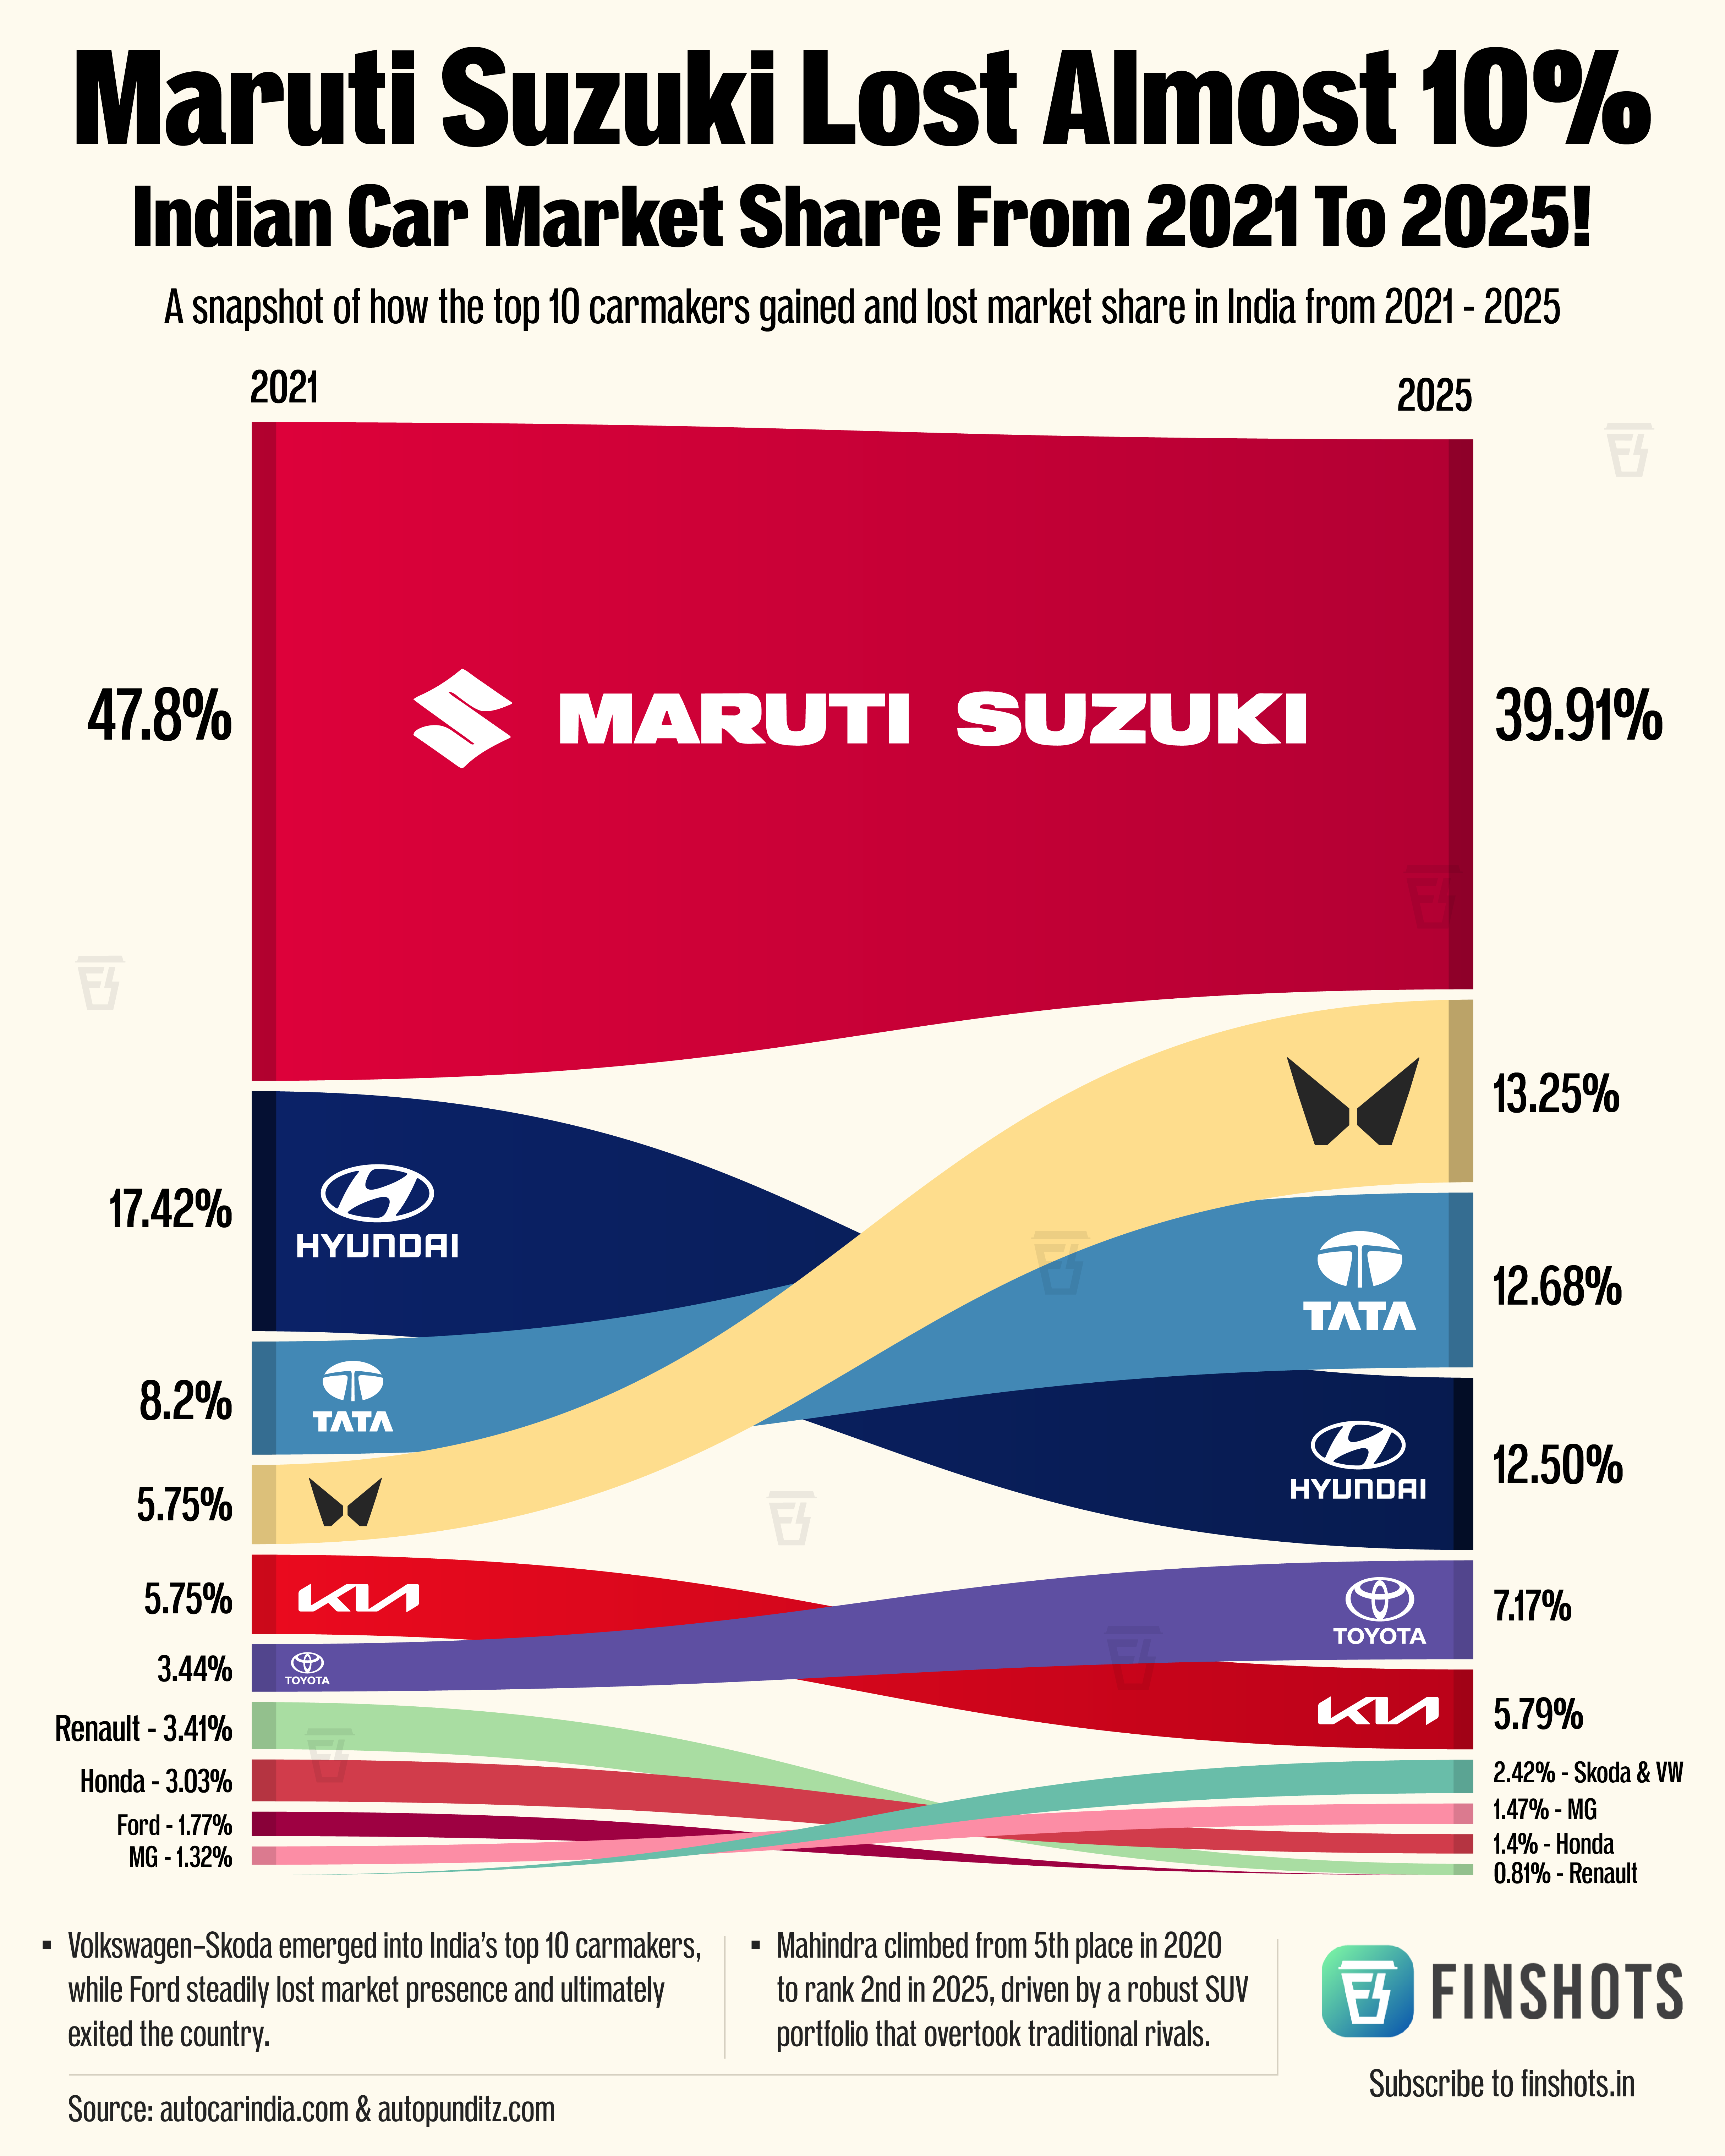
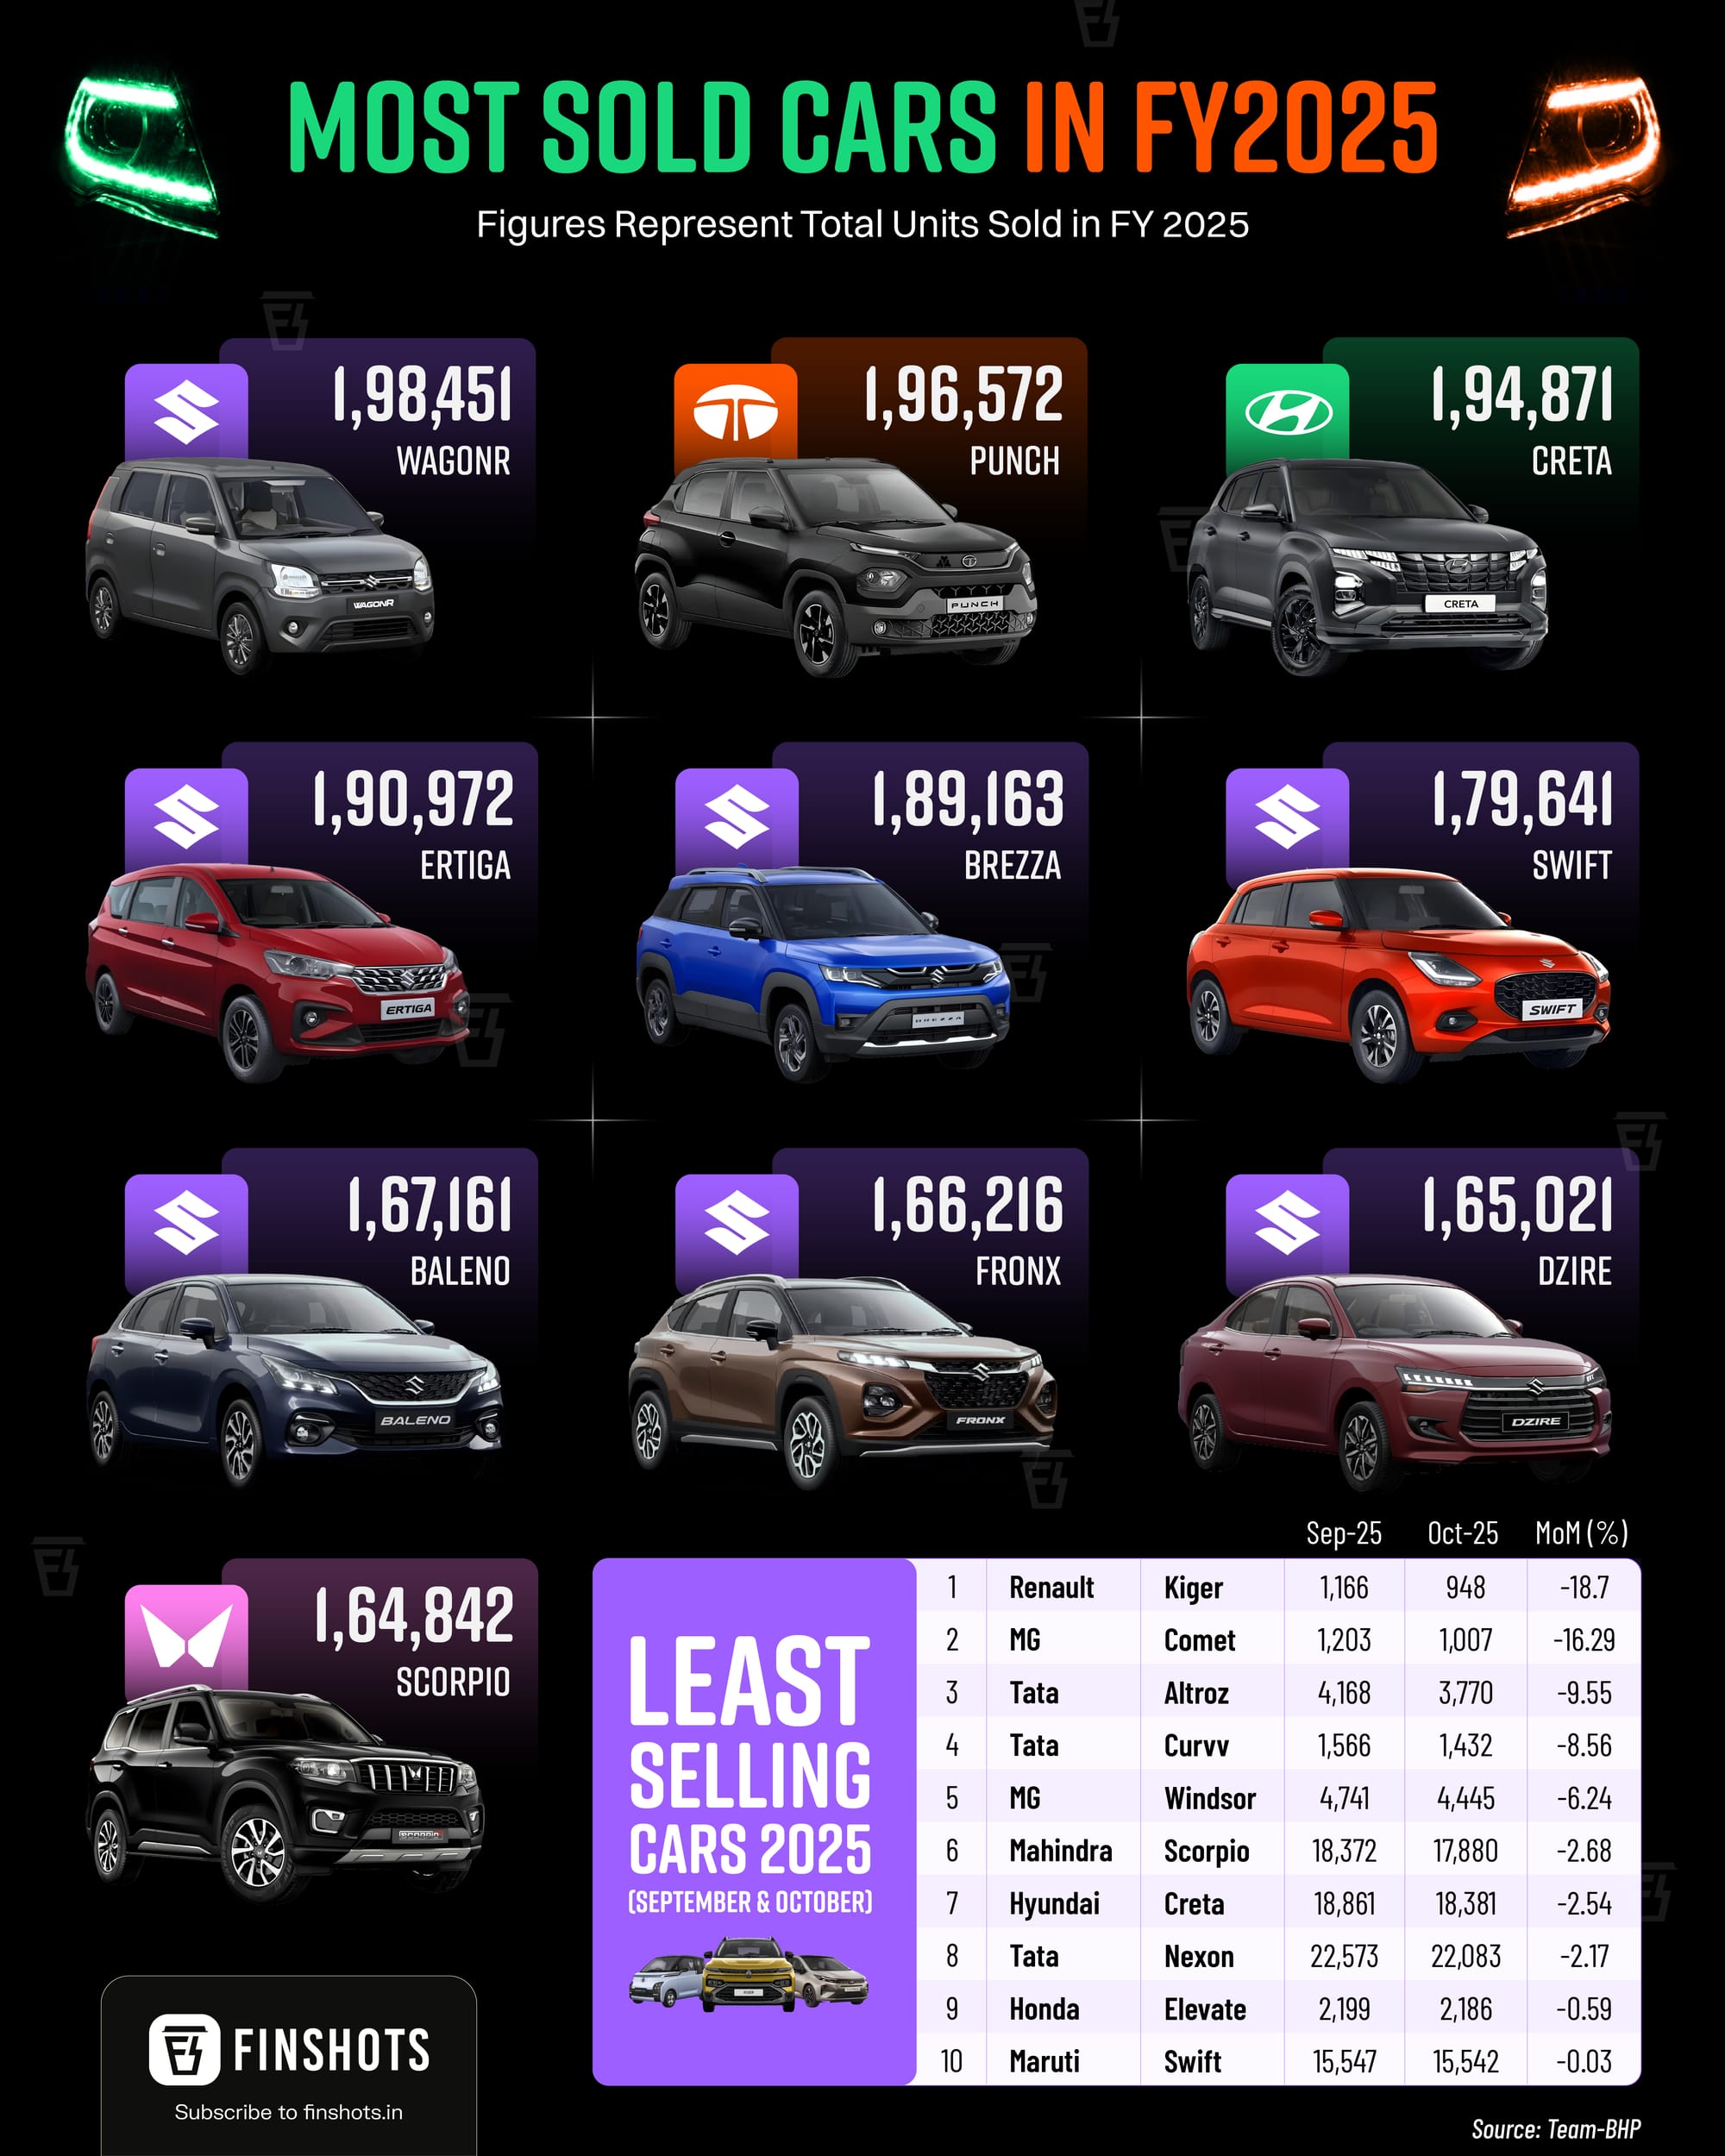
infographic Indian Car Market Share from 2021 to 2025 An infographic showing how the top 10 carmakers gained and lost market share in India from 2021 to 2025.
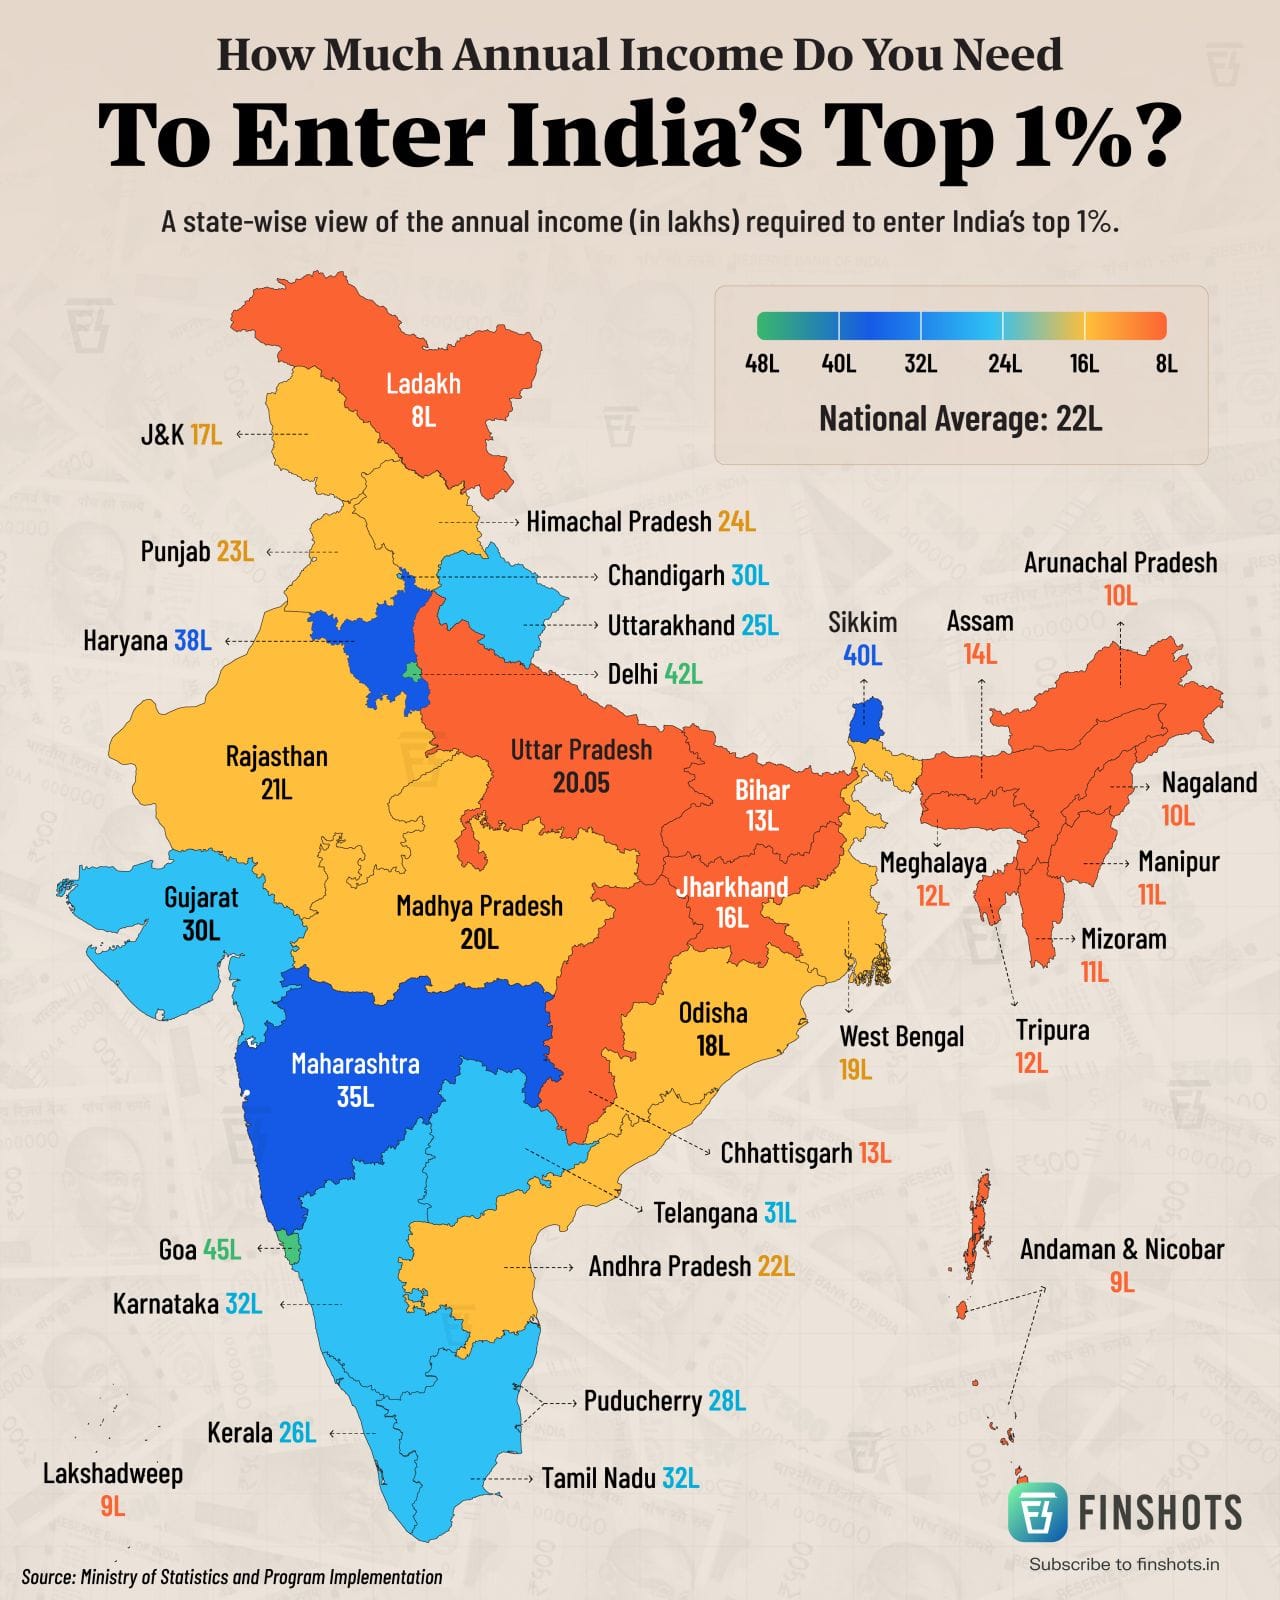
infographic State-Wise Top 1% Annual Income A state-wise view of the annual income (in lakhs) required to enter India's top 1%.
infographic India's Top Sources of Crude Oil An infographic representing India's top sources of crude oil.
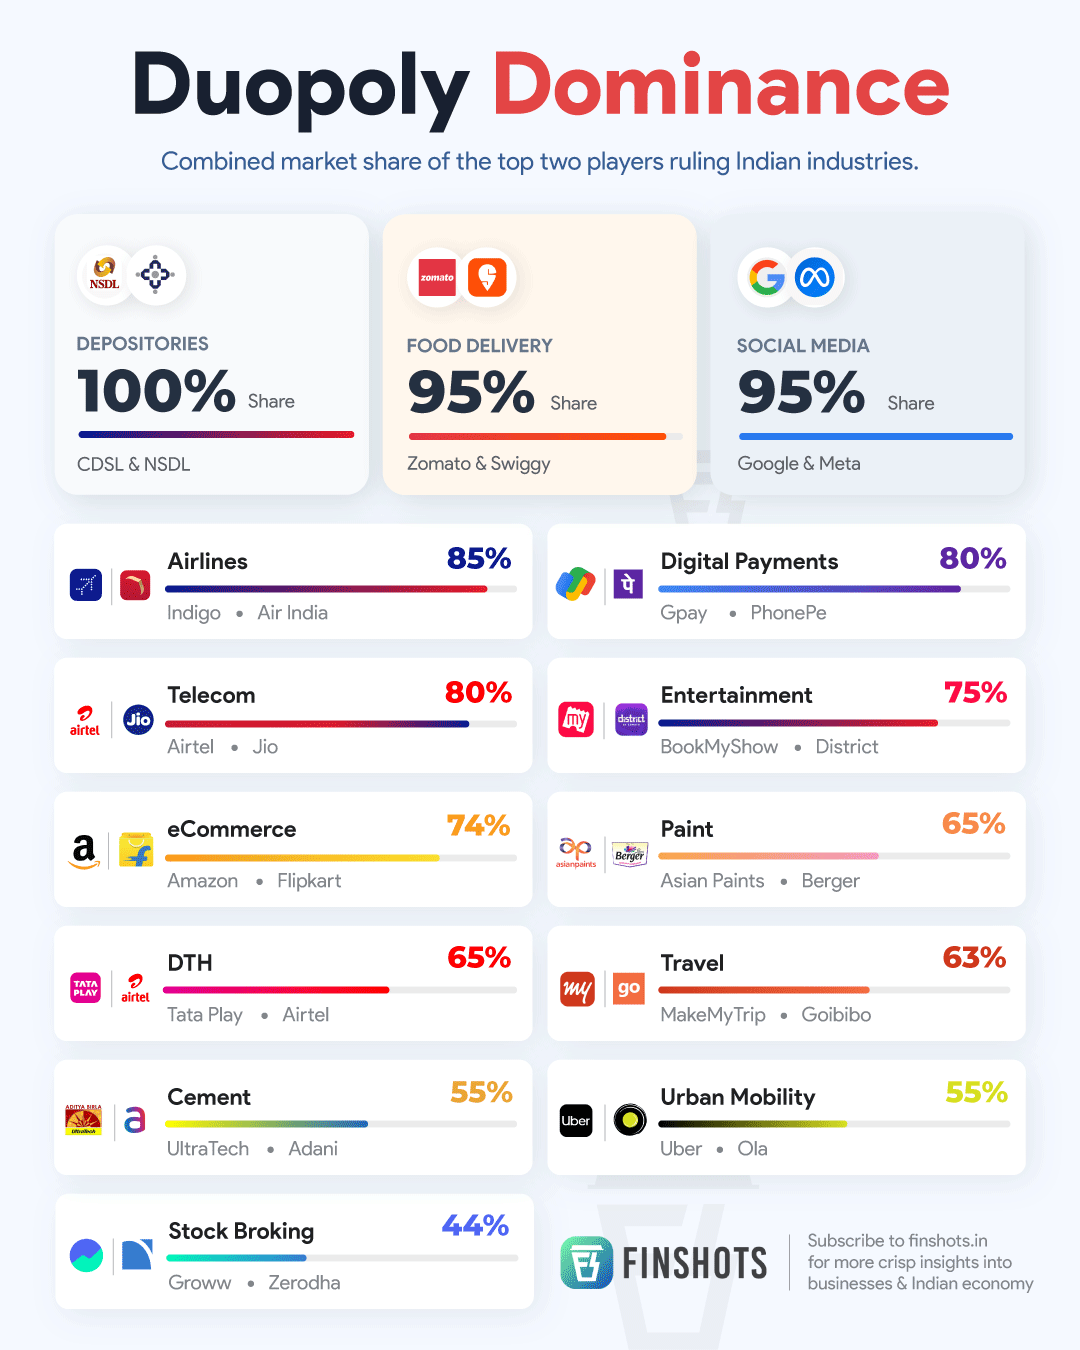
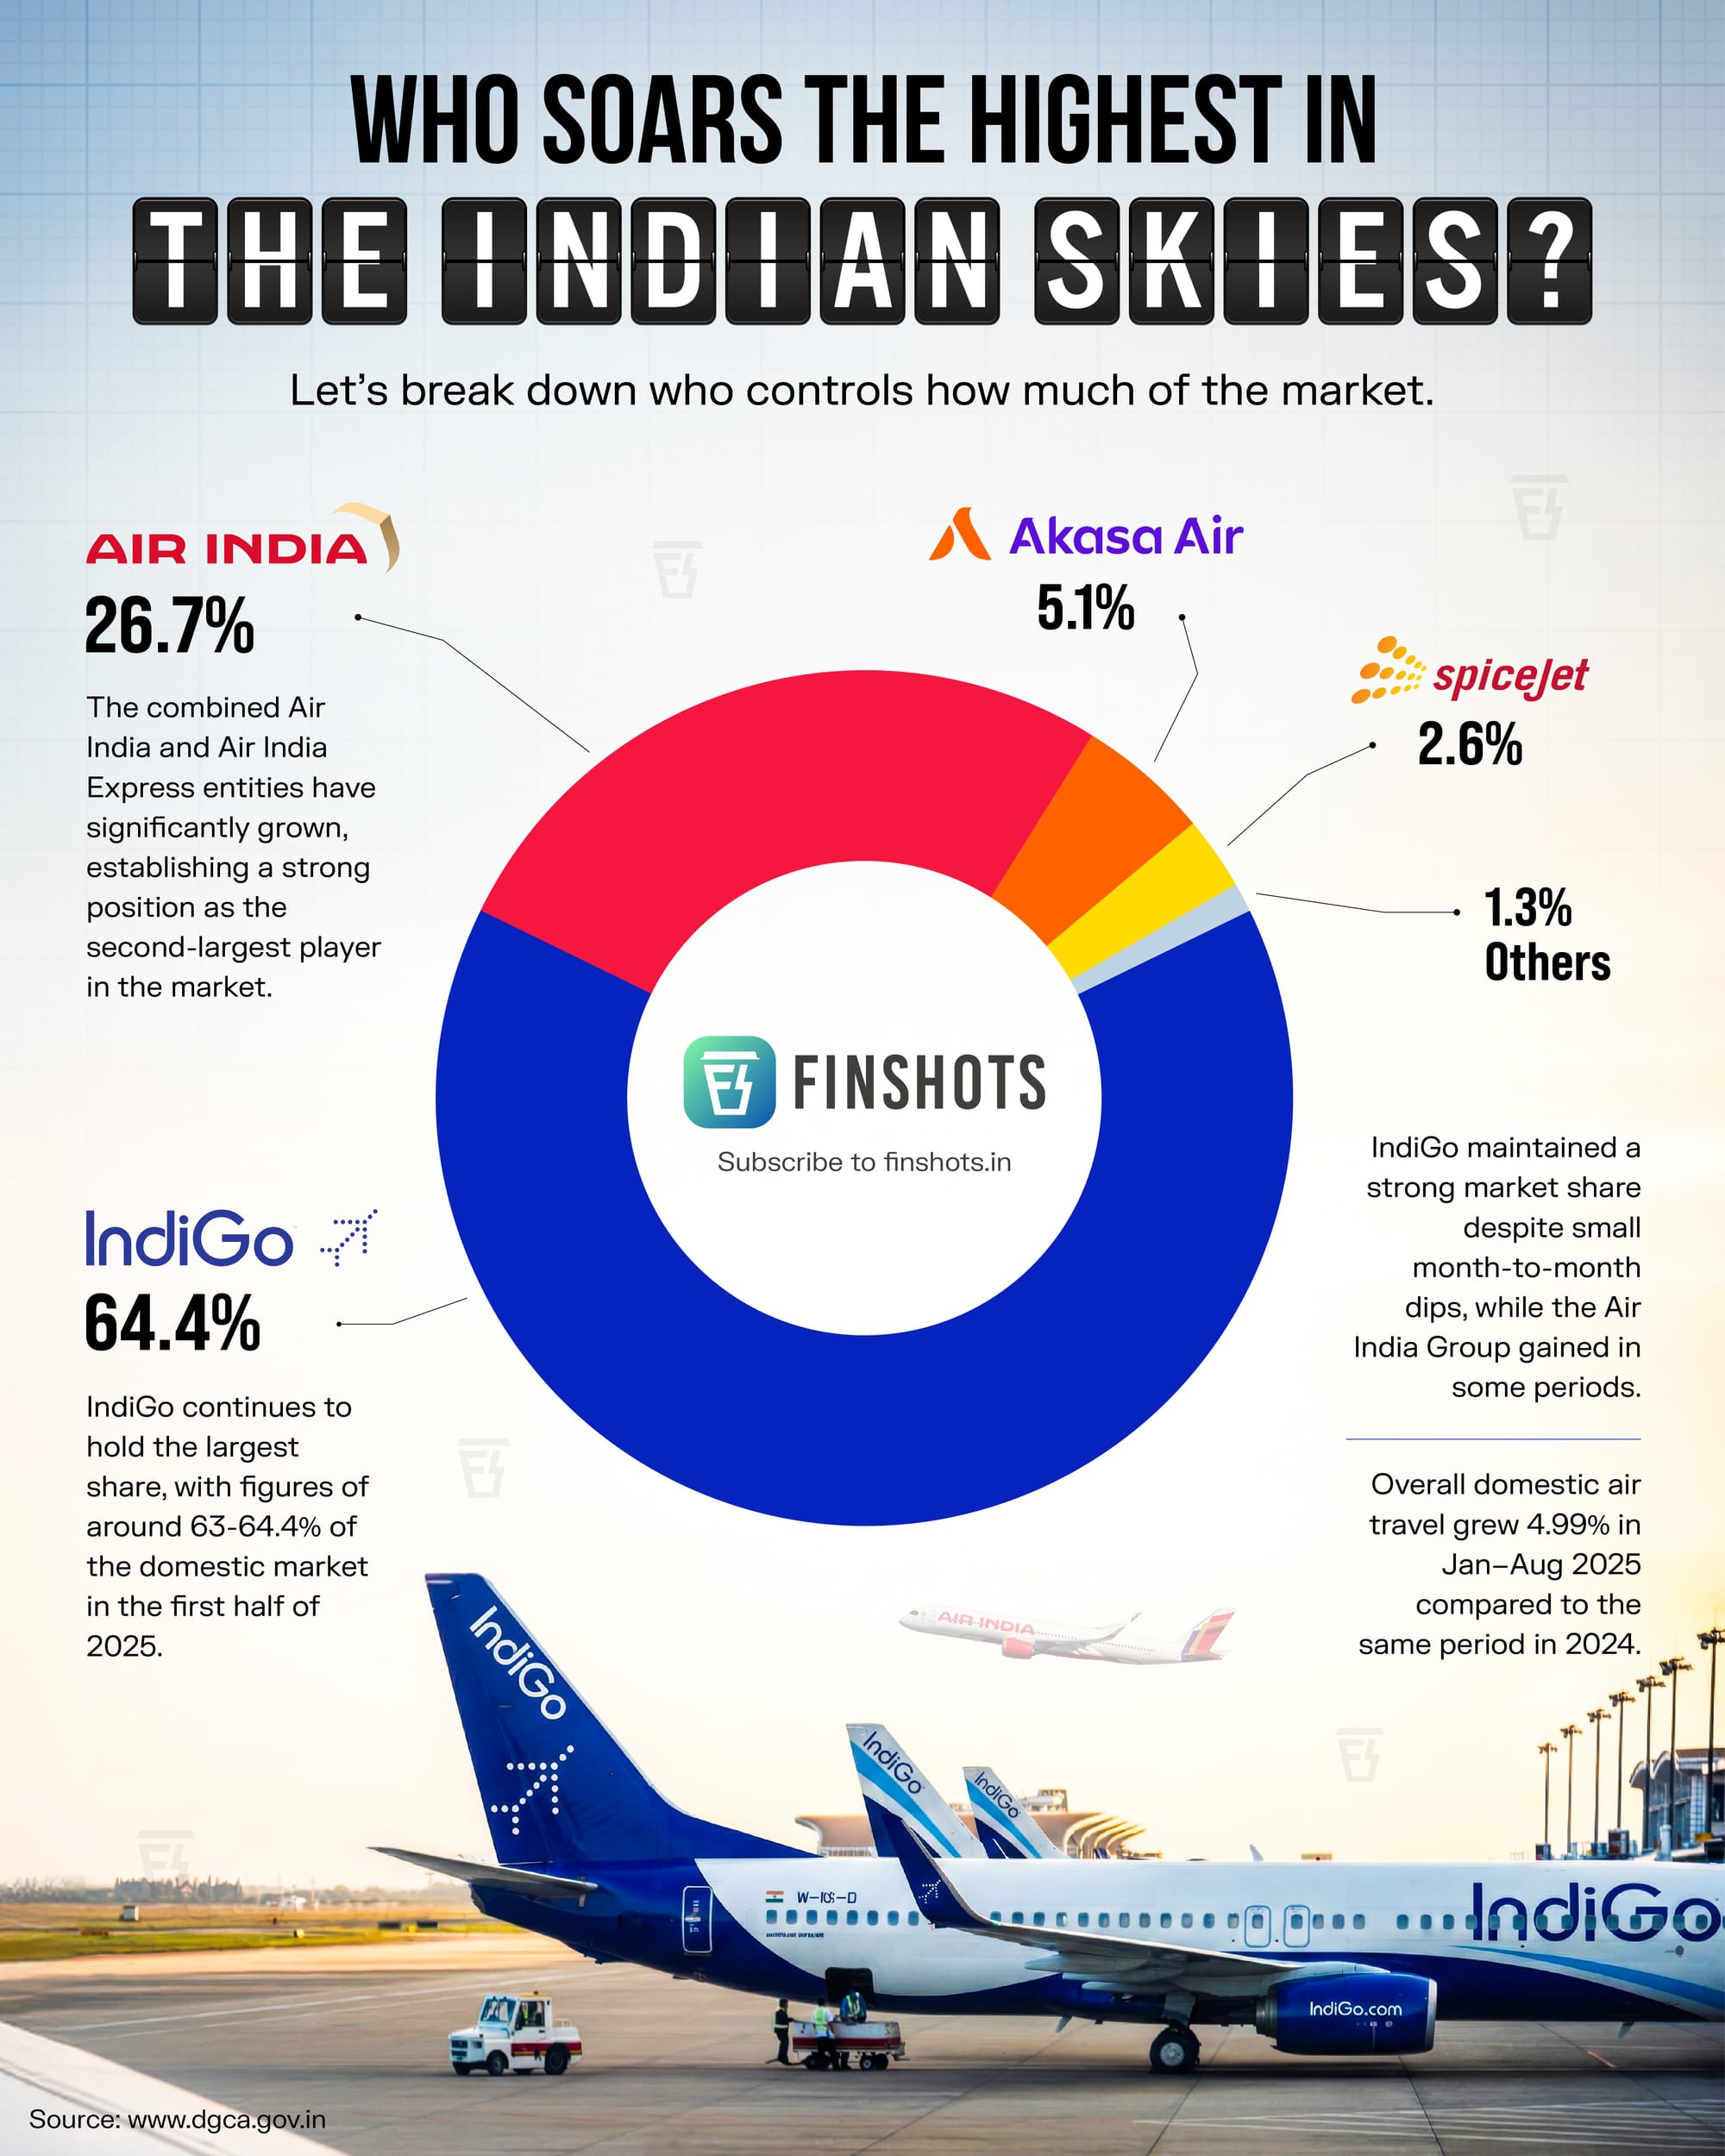
infographic Duopoly Dominance in India Combined market share of the top two players ruling Indian industries.
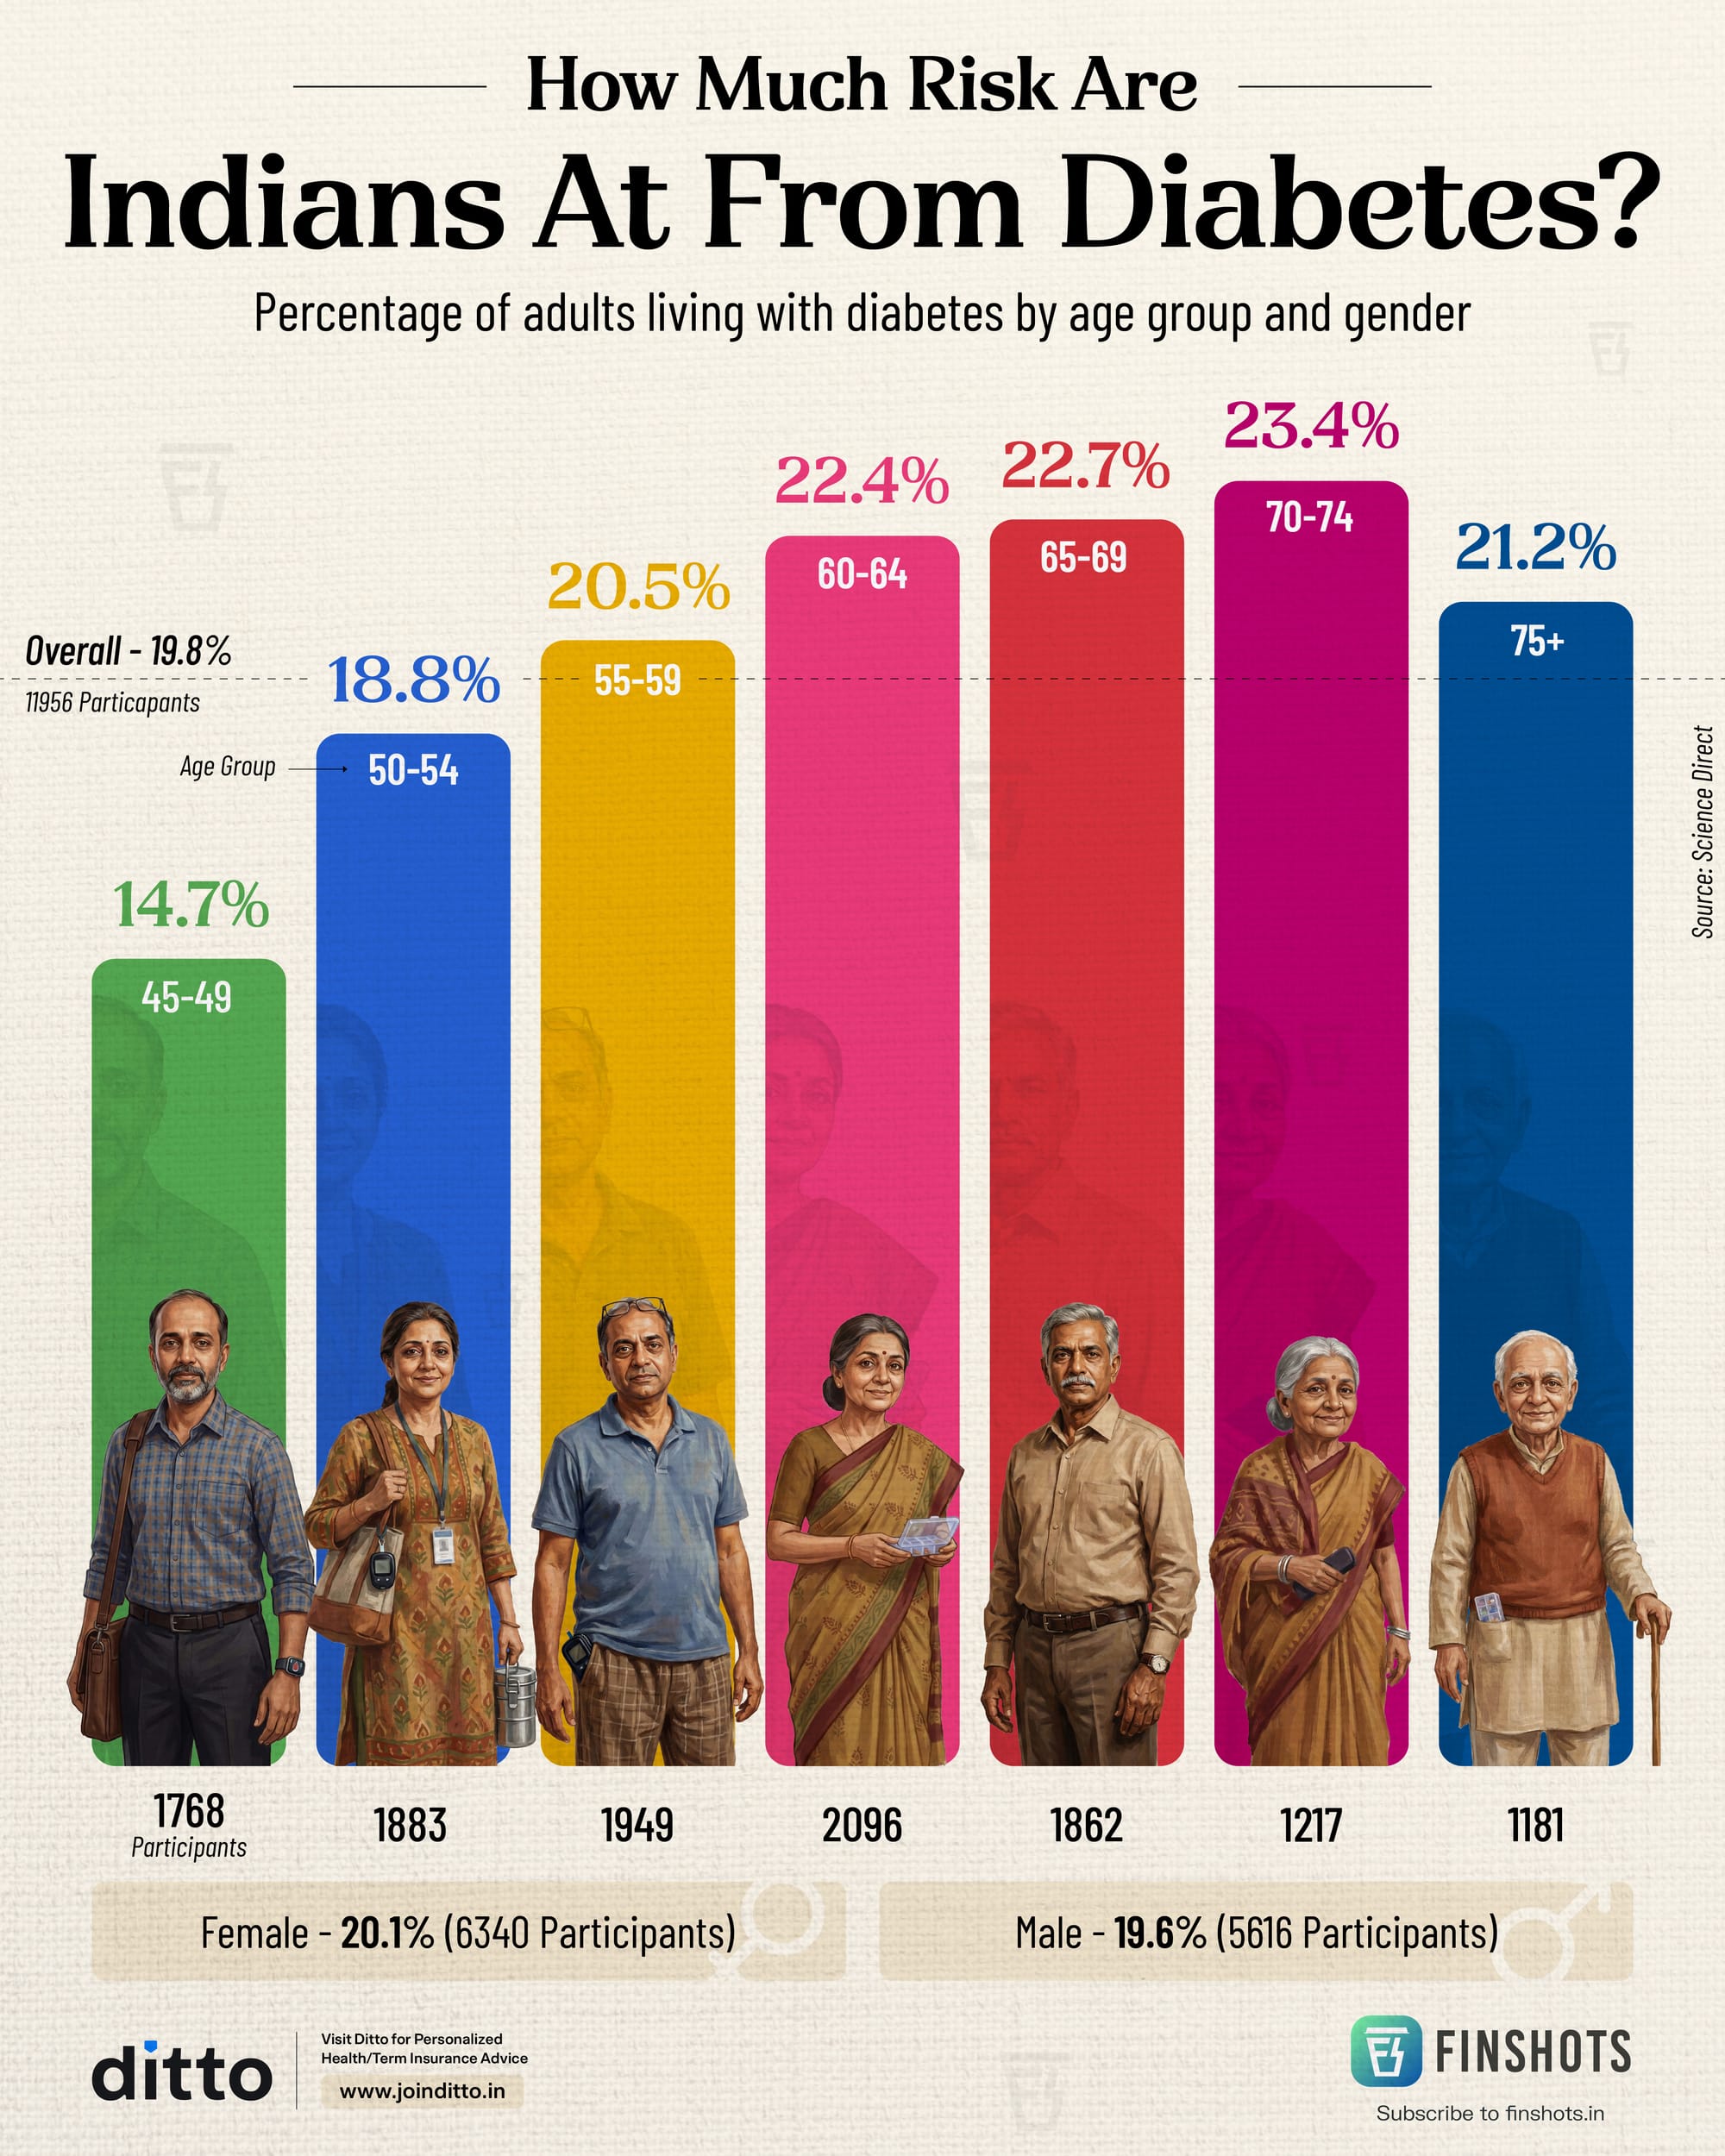
infographic Diabetes Prevalence in India Percentage of adults living with diabetes by age group and gender.
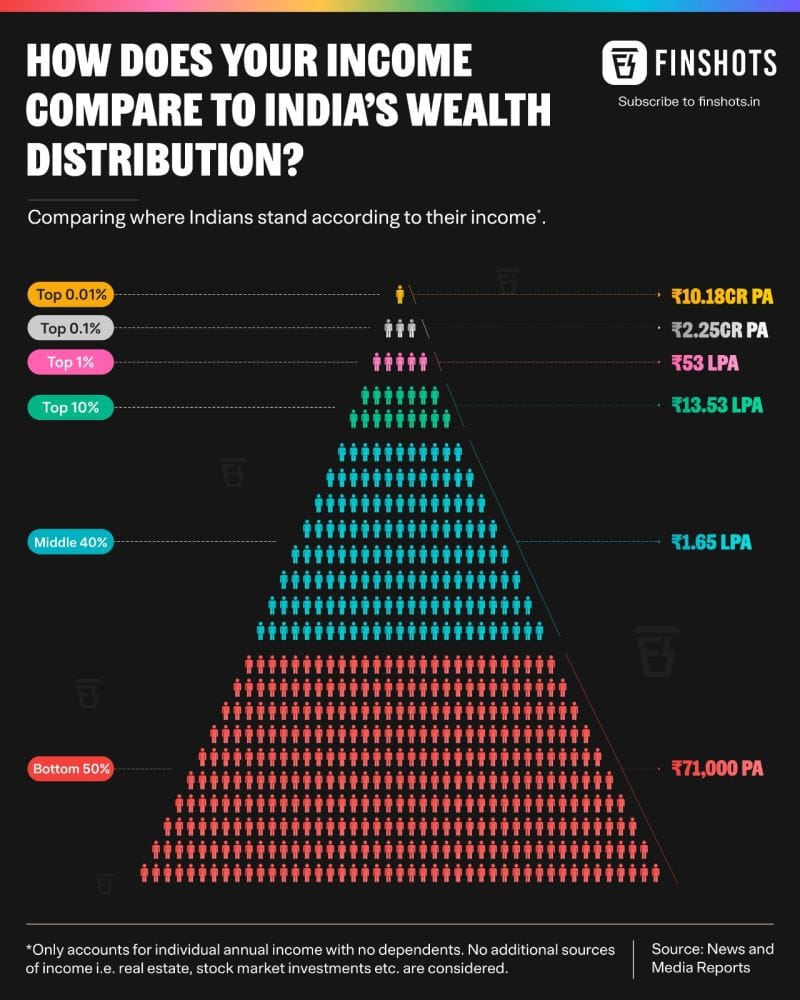
infographic India's Wealth Distribution A look at how the top 0.01% earn over ₹10 crore a year, while half the population earns less than ₹71,000—highlighting just how lopsided the pyramid really is.
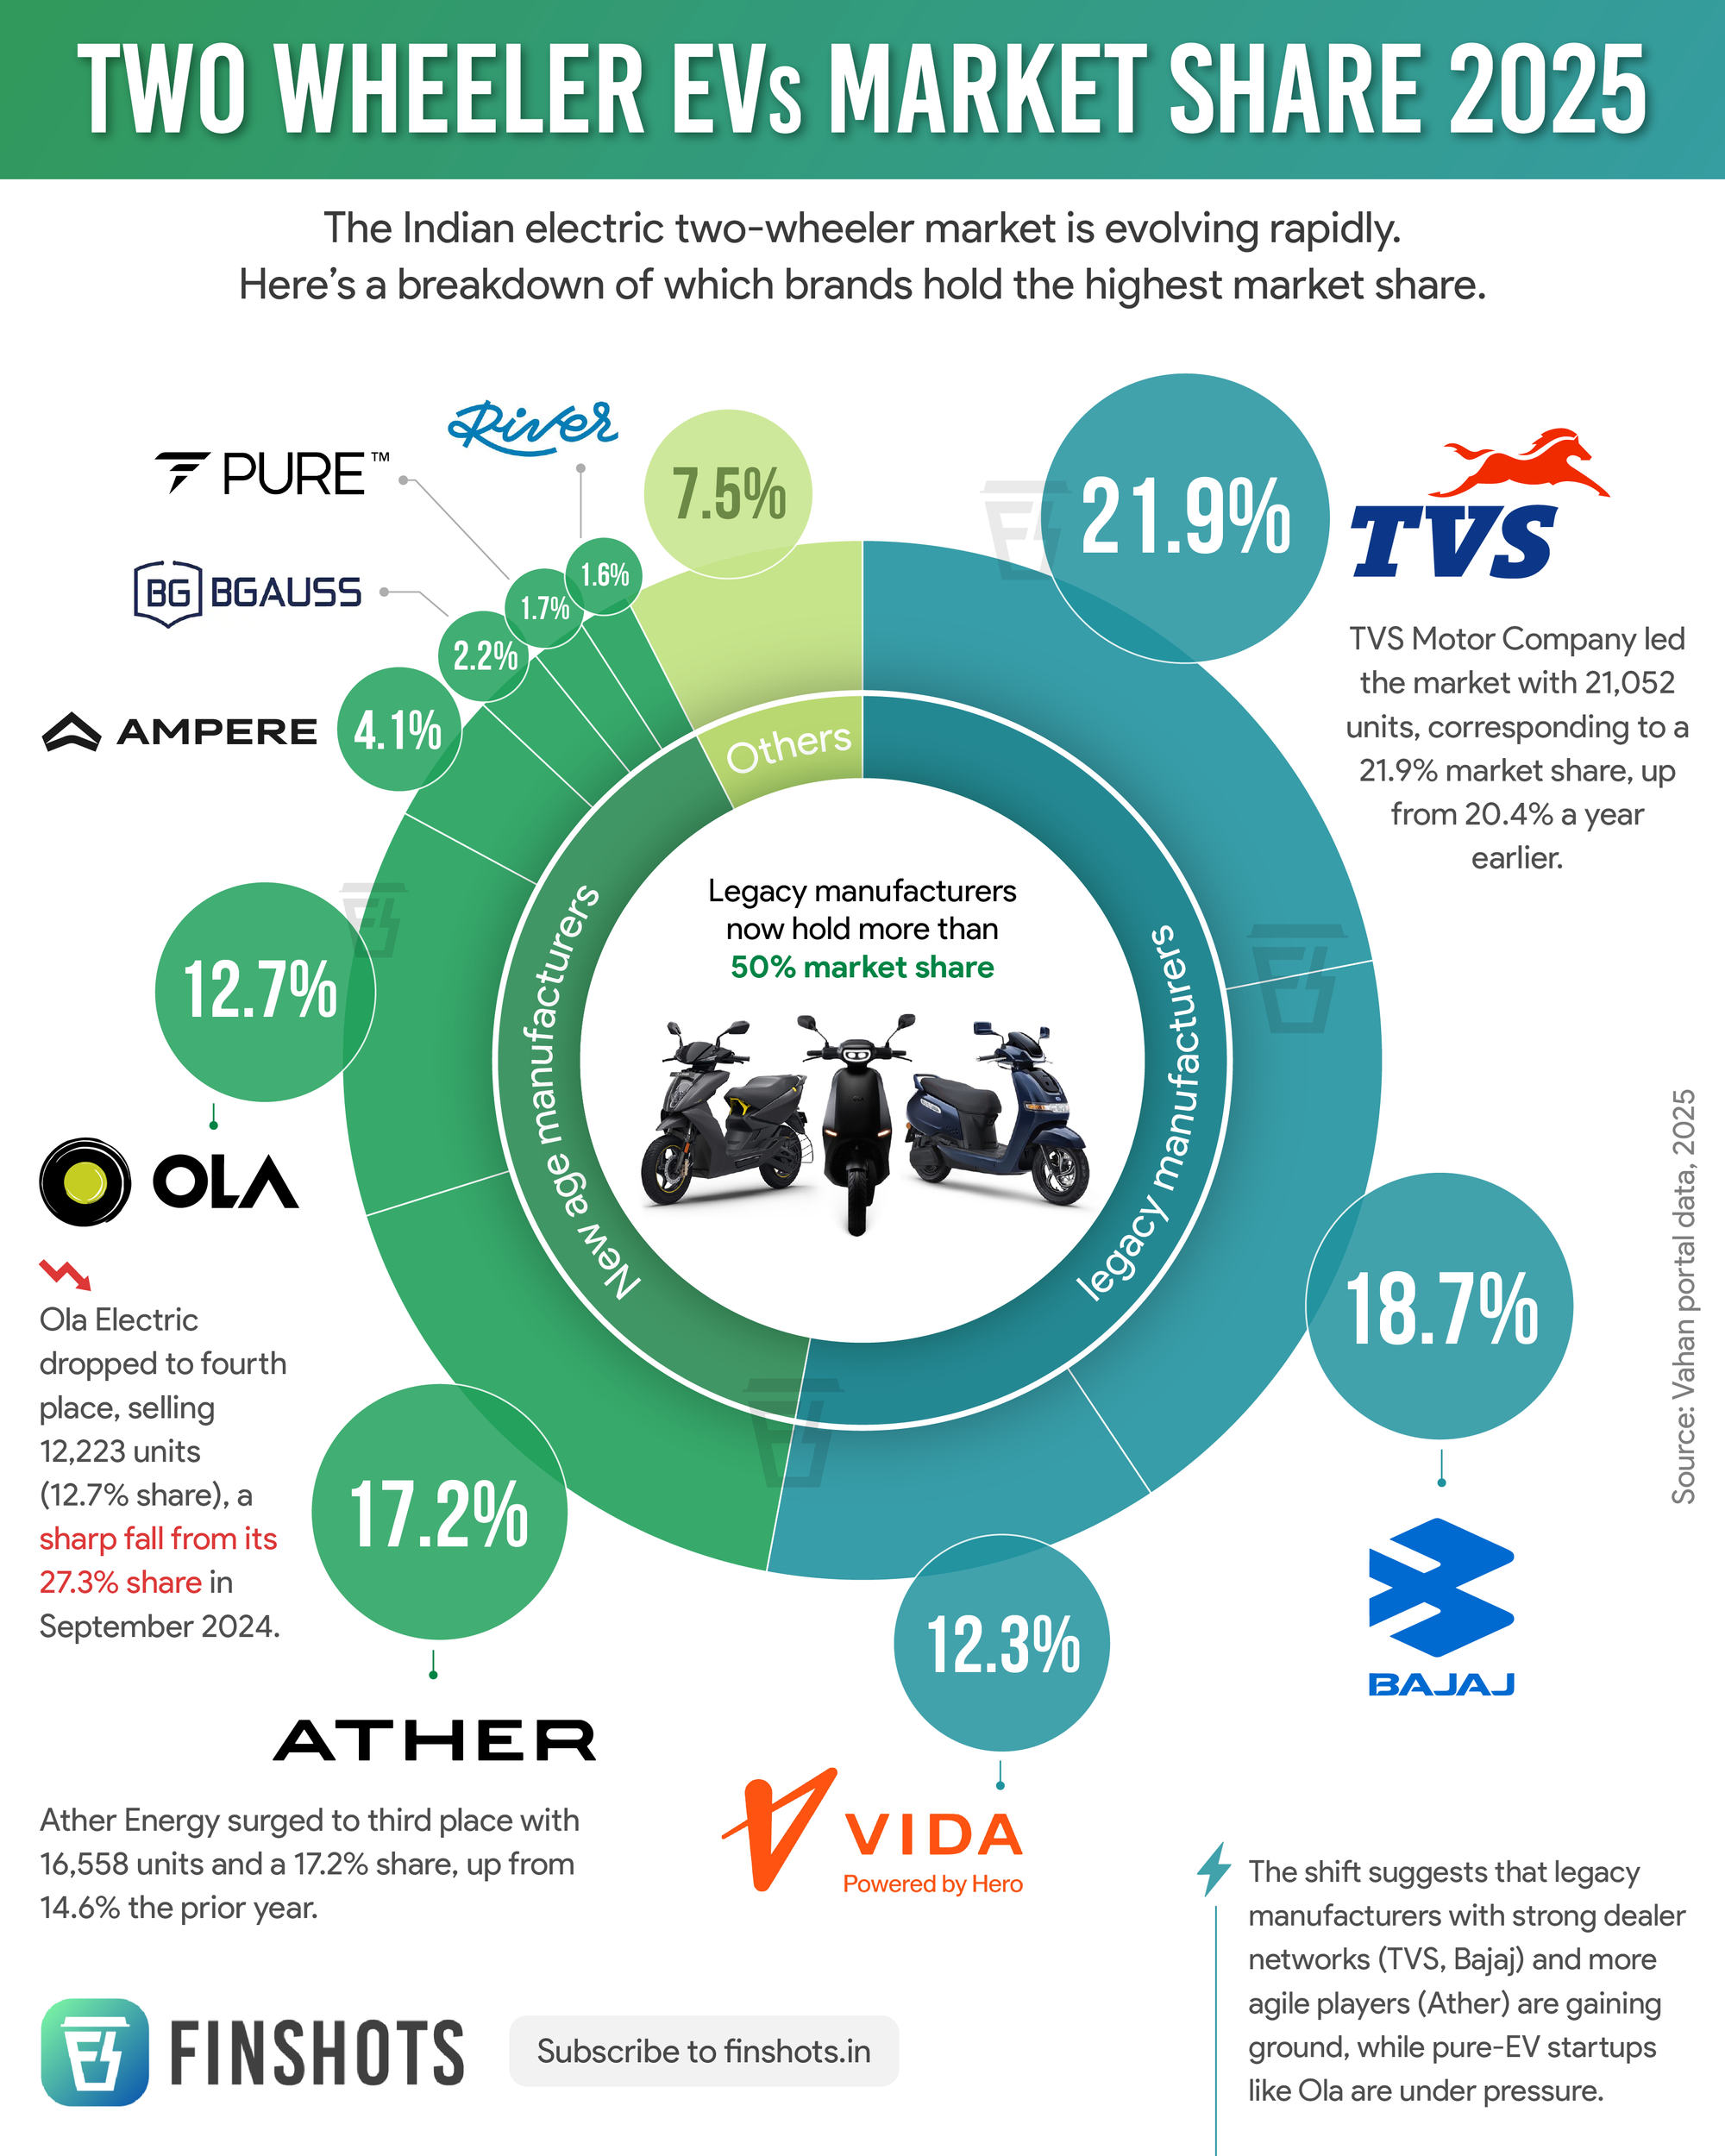
infographic Two-Wheeler EVs Market Share in India An infographic depicting the market share of two-wheeler companies in India.
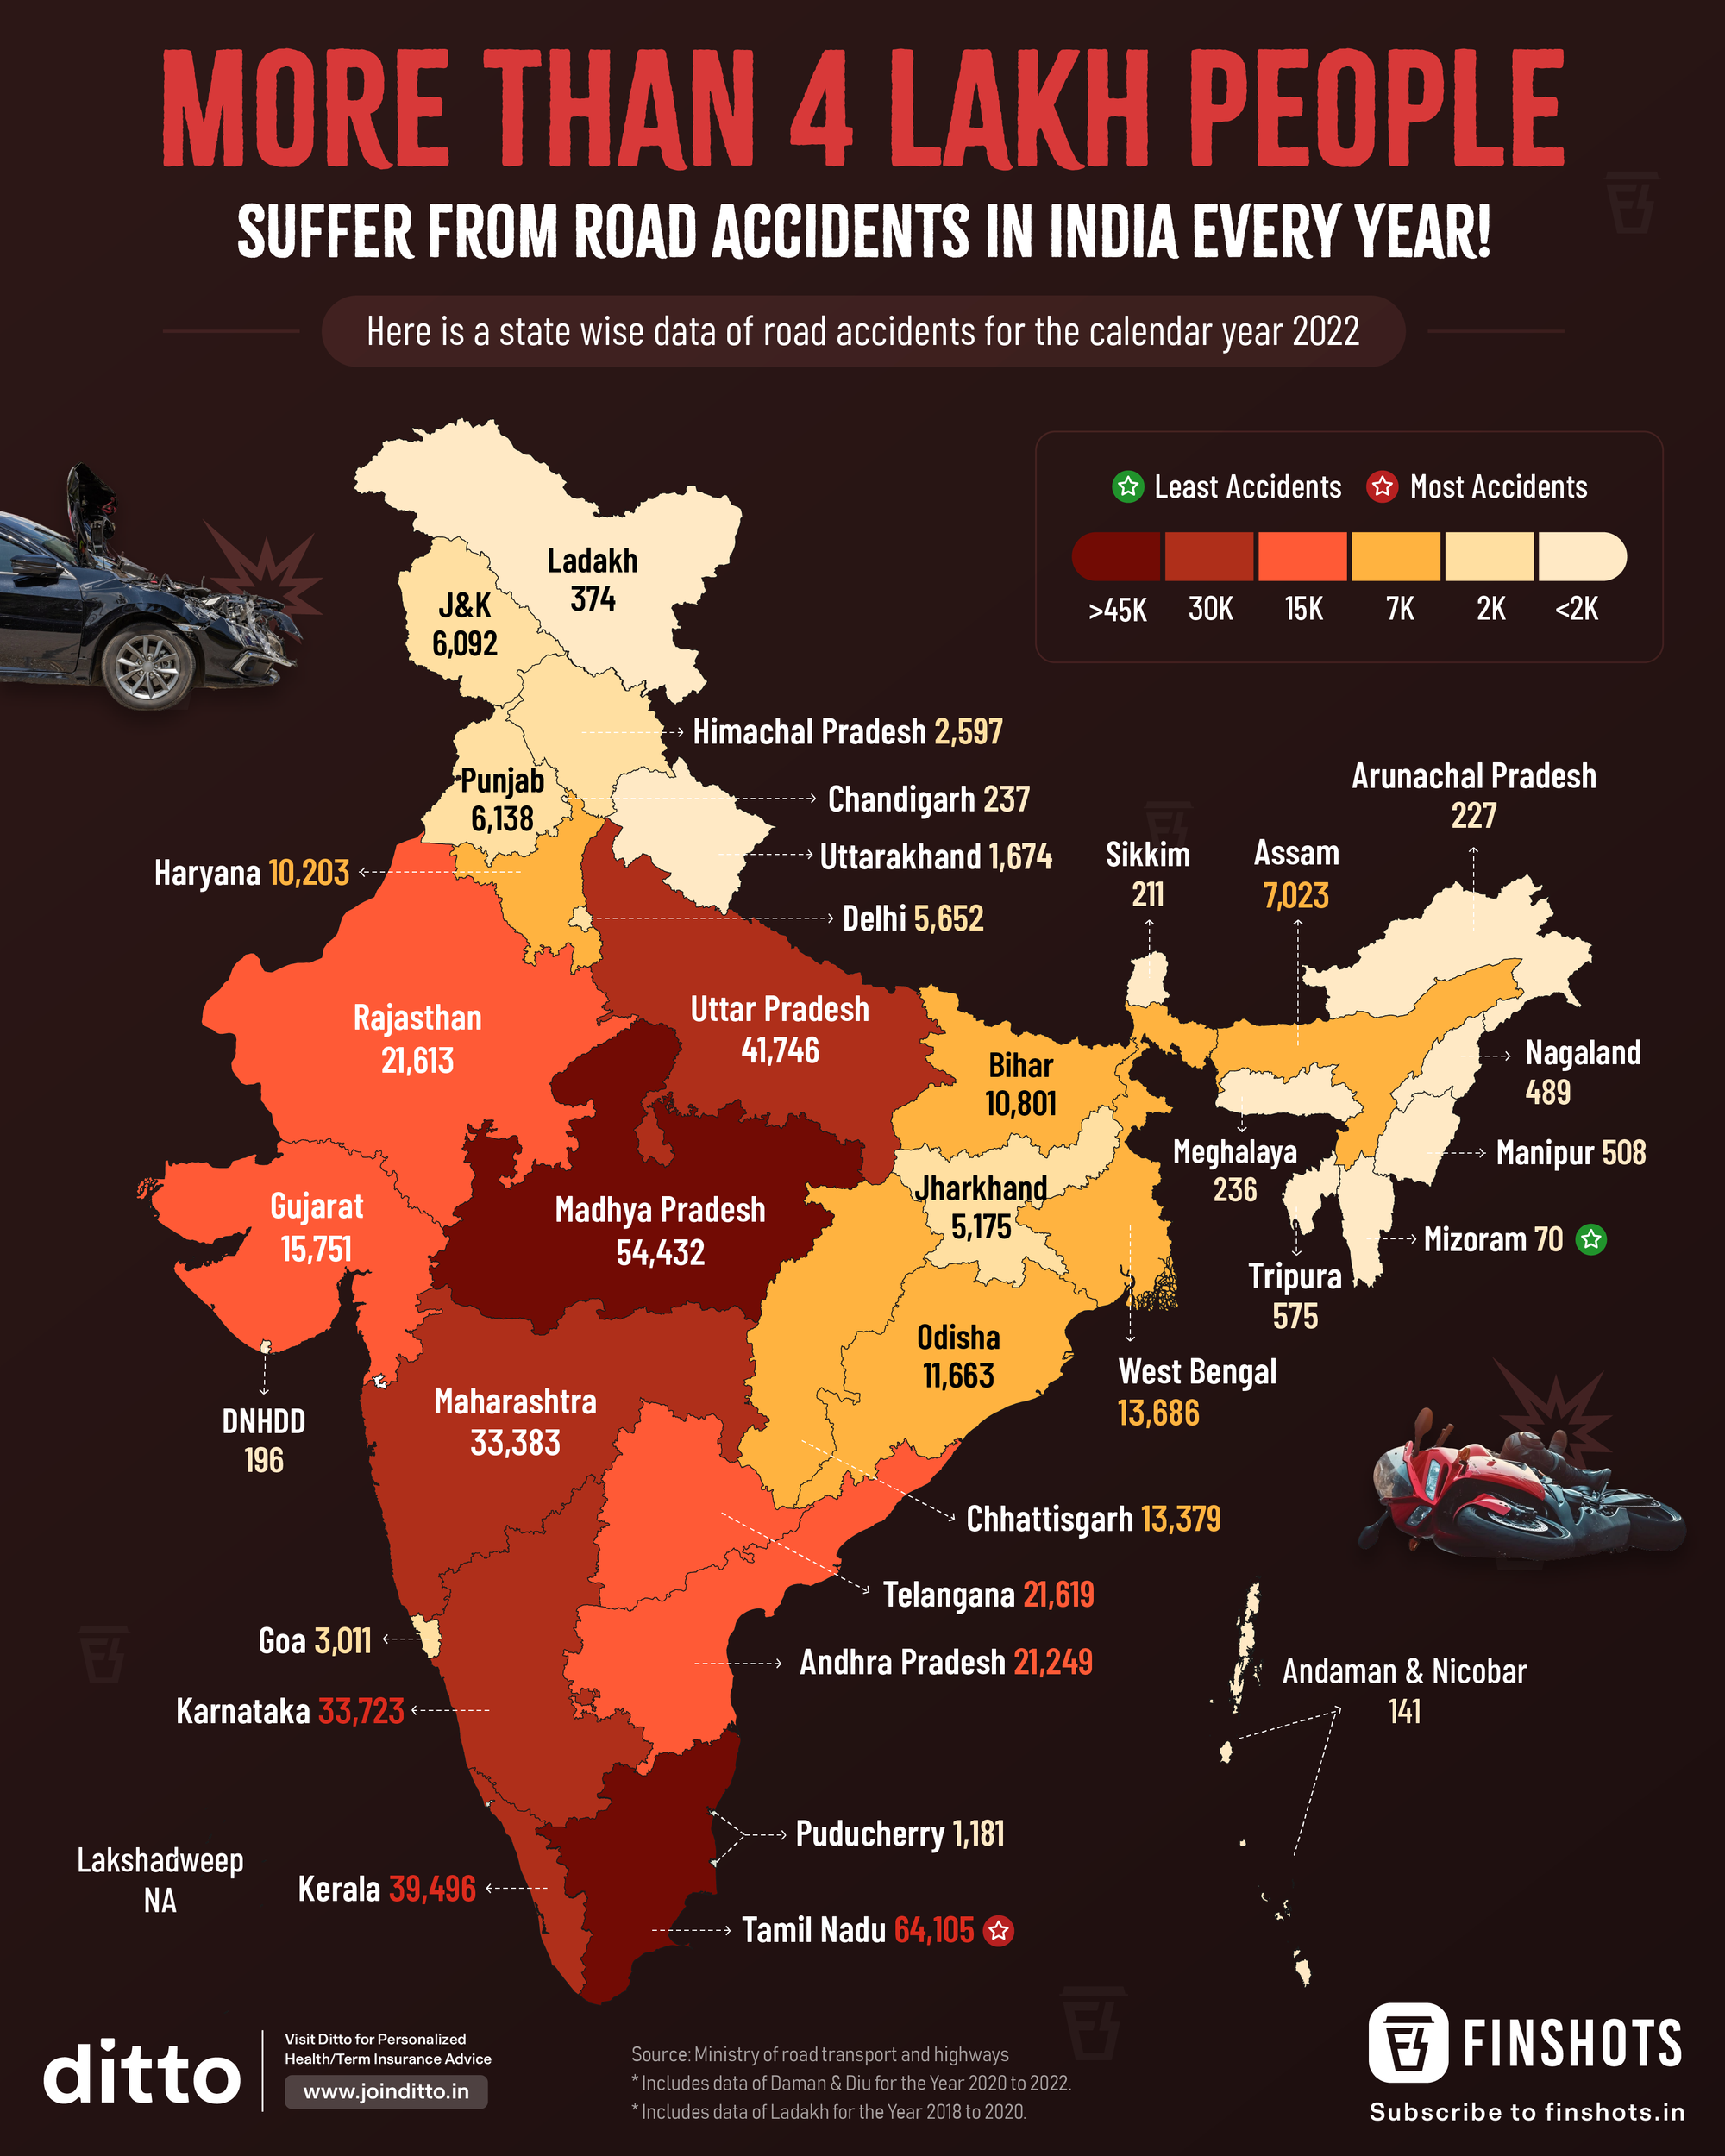
infographic State-wise Road Accidents in India A state-wise look at number of road accidents in India in 2022.
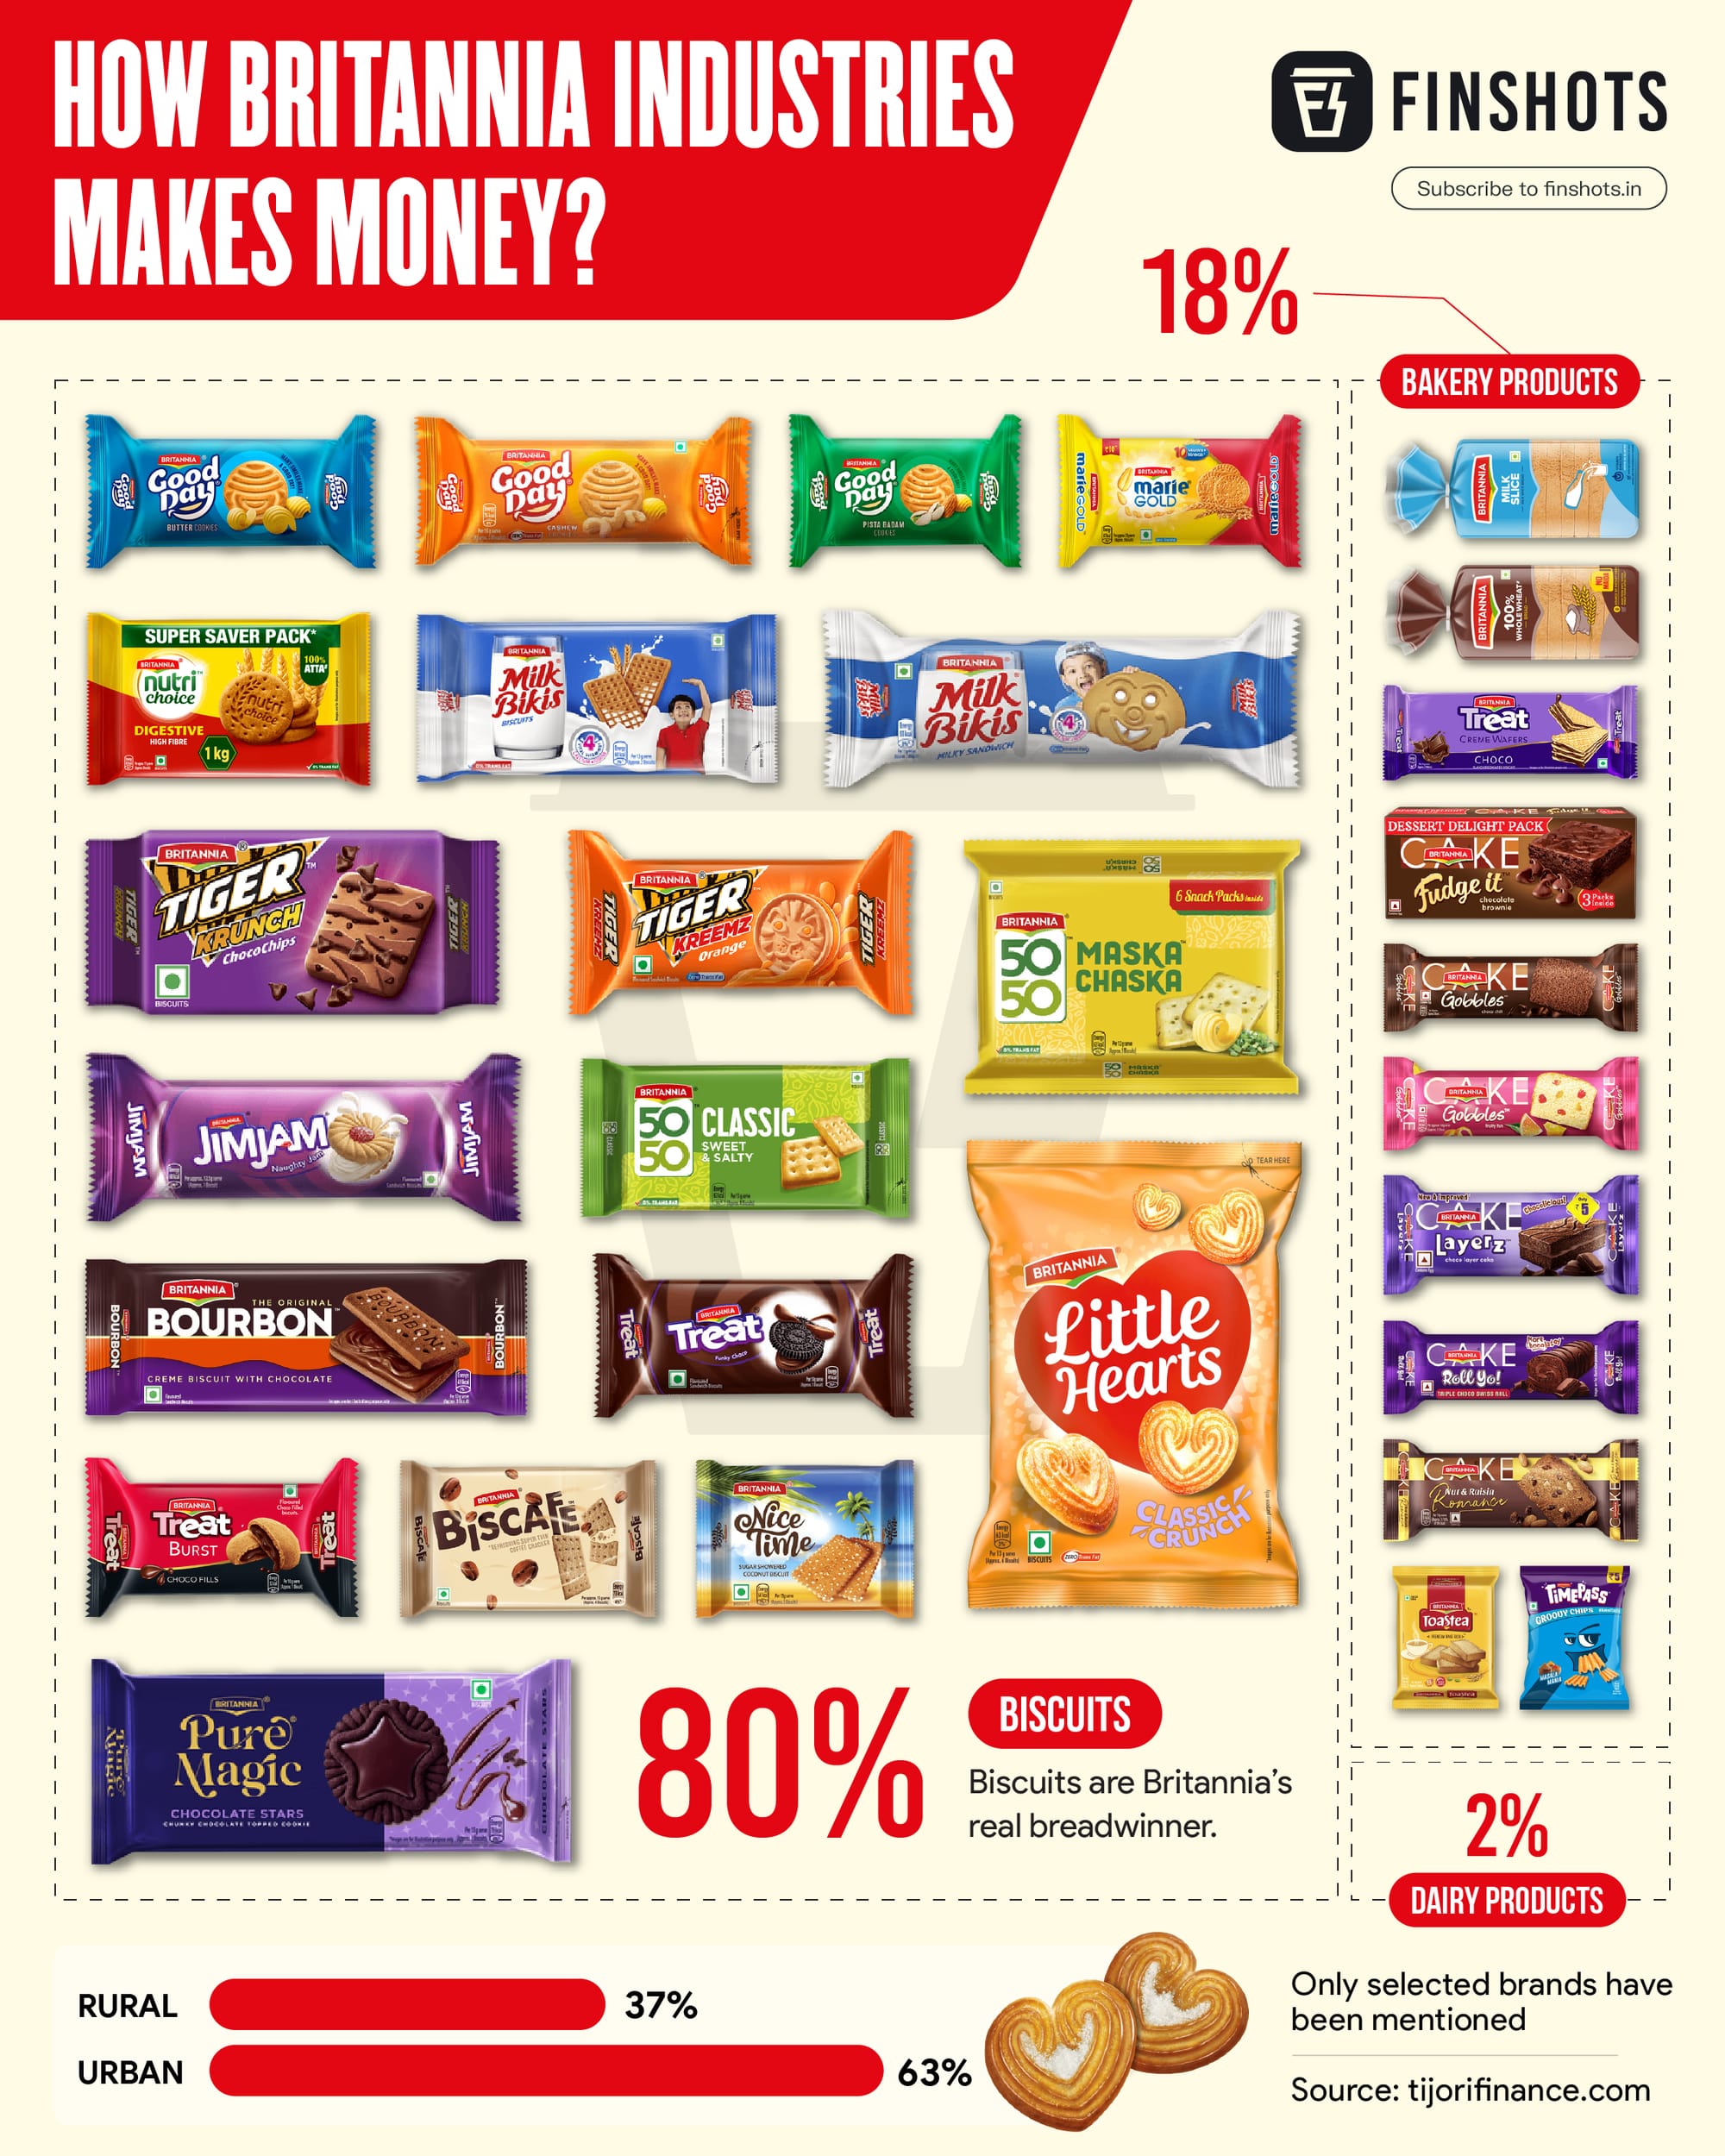
infographic How Britannia Industries Makes Money? A breakdown of Britannia's revenue based on products.
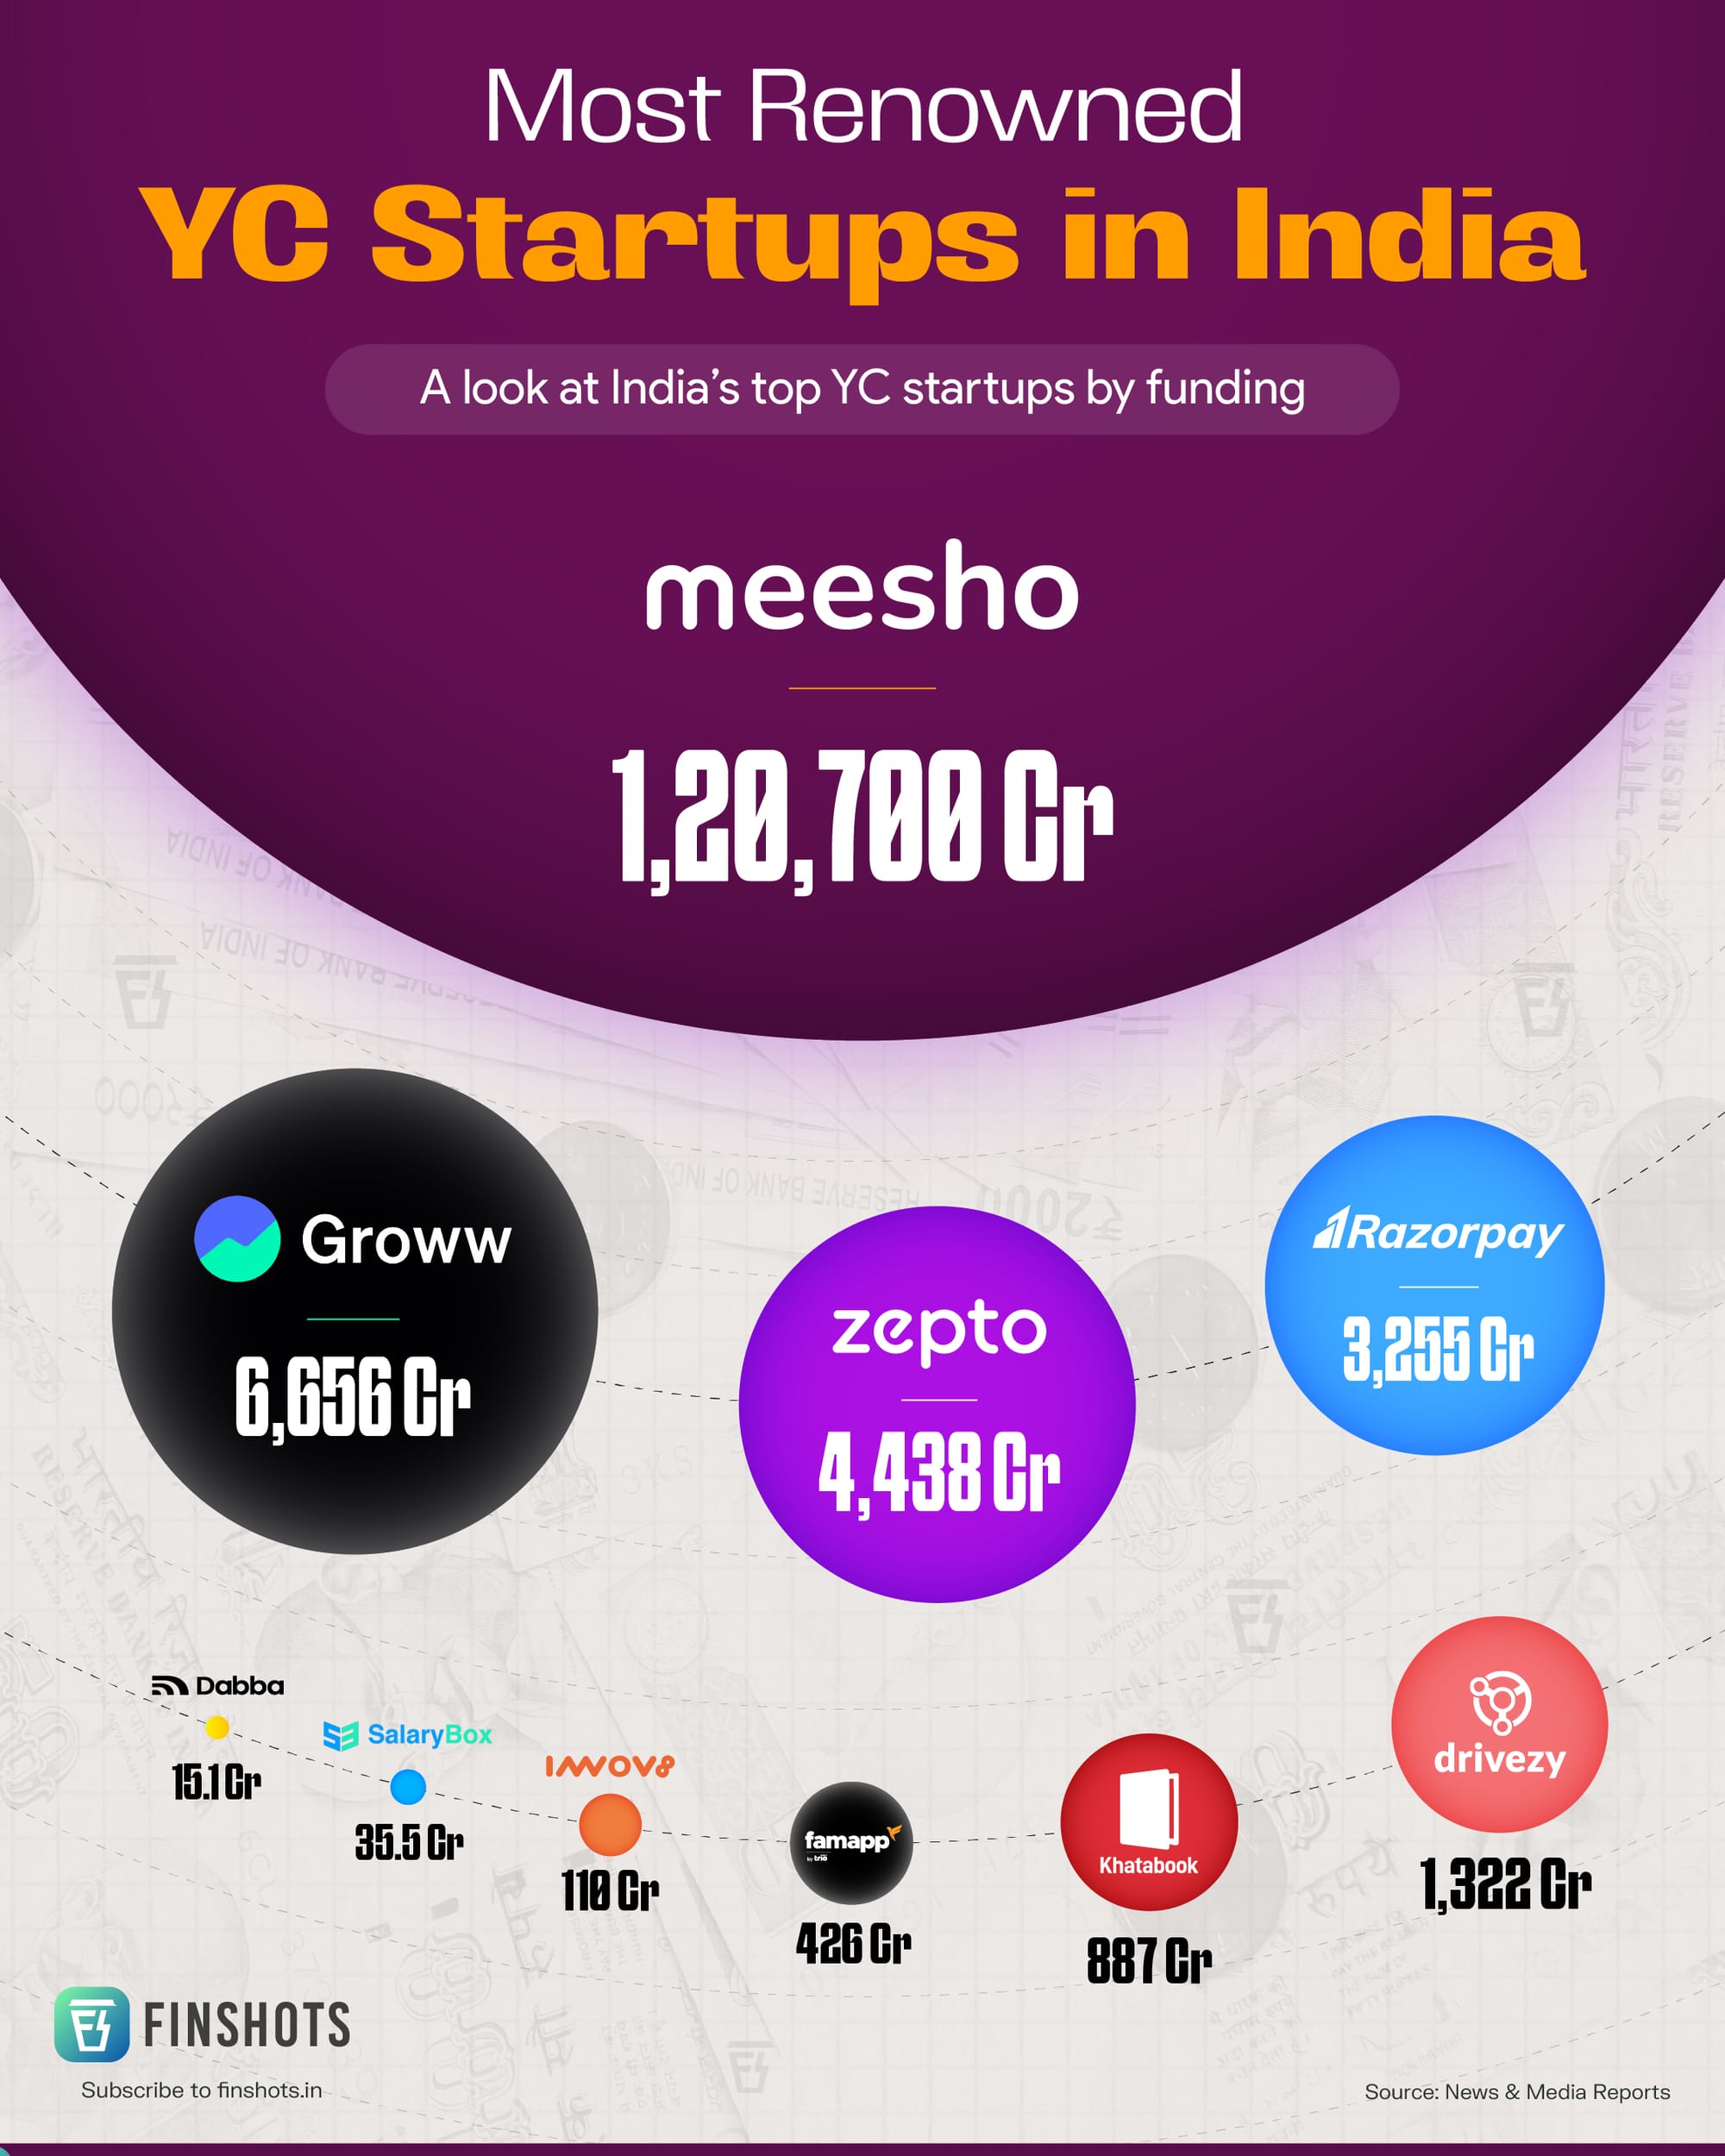
infographic Most Renowned VC Startups in India A look at some of the top YC backed startups in India based on their revenue!
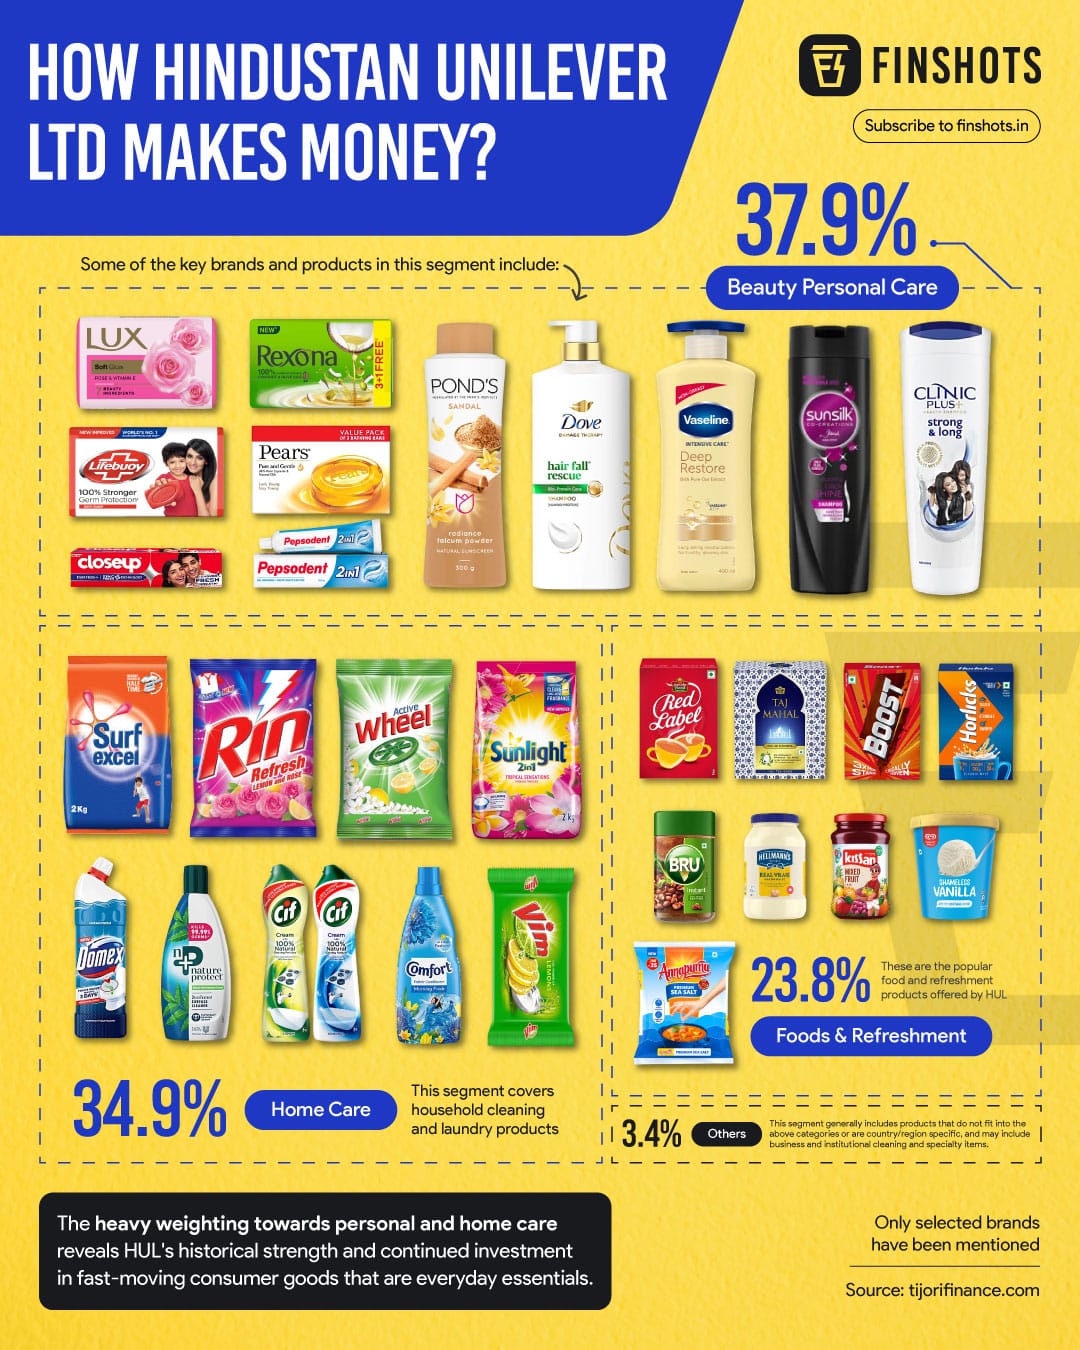
infographic How HUL Makes Money? A look at how Hindustan Unilever has a strong grip across India in the FMCG sector!
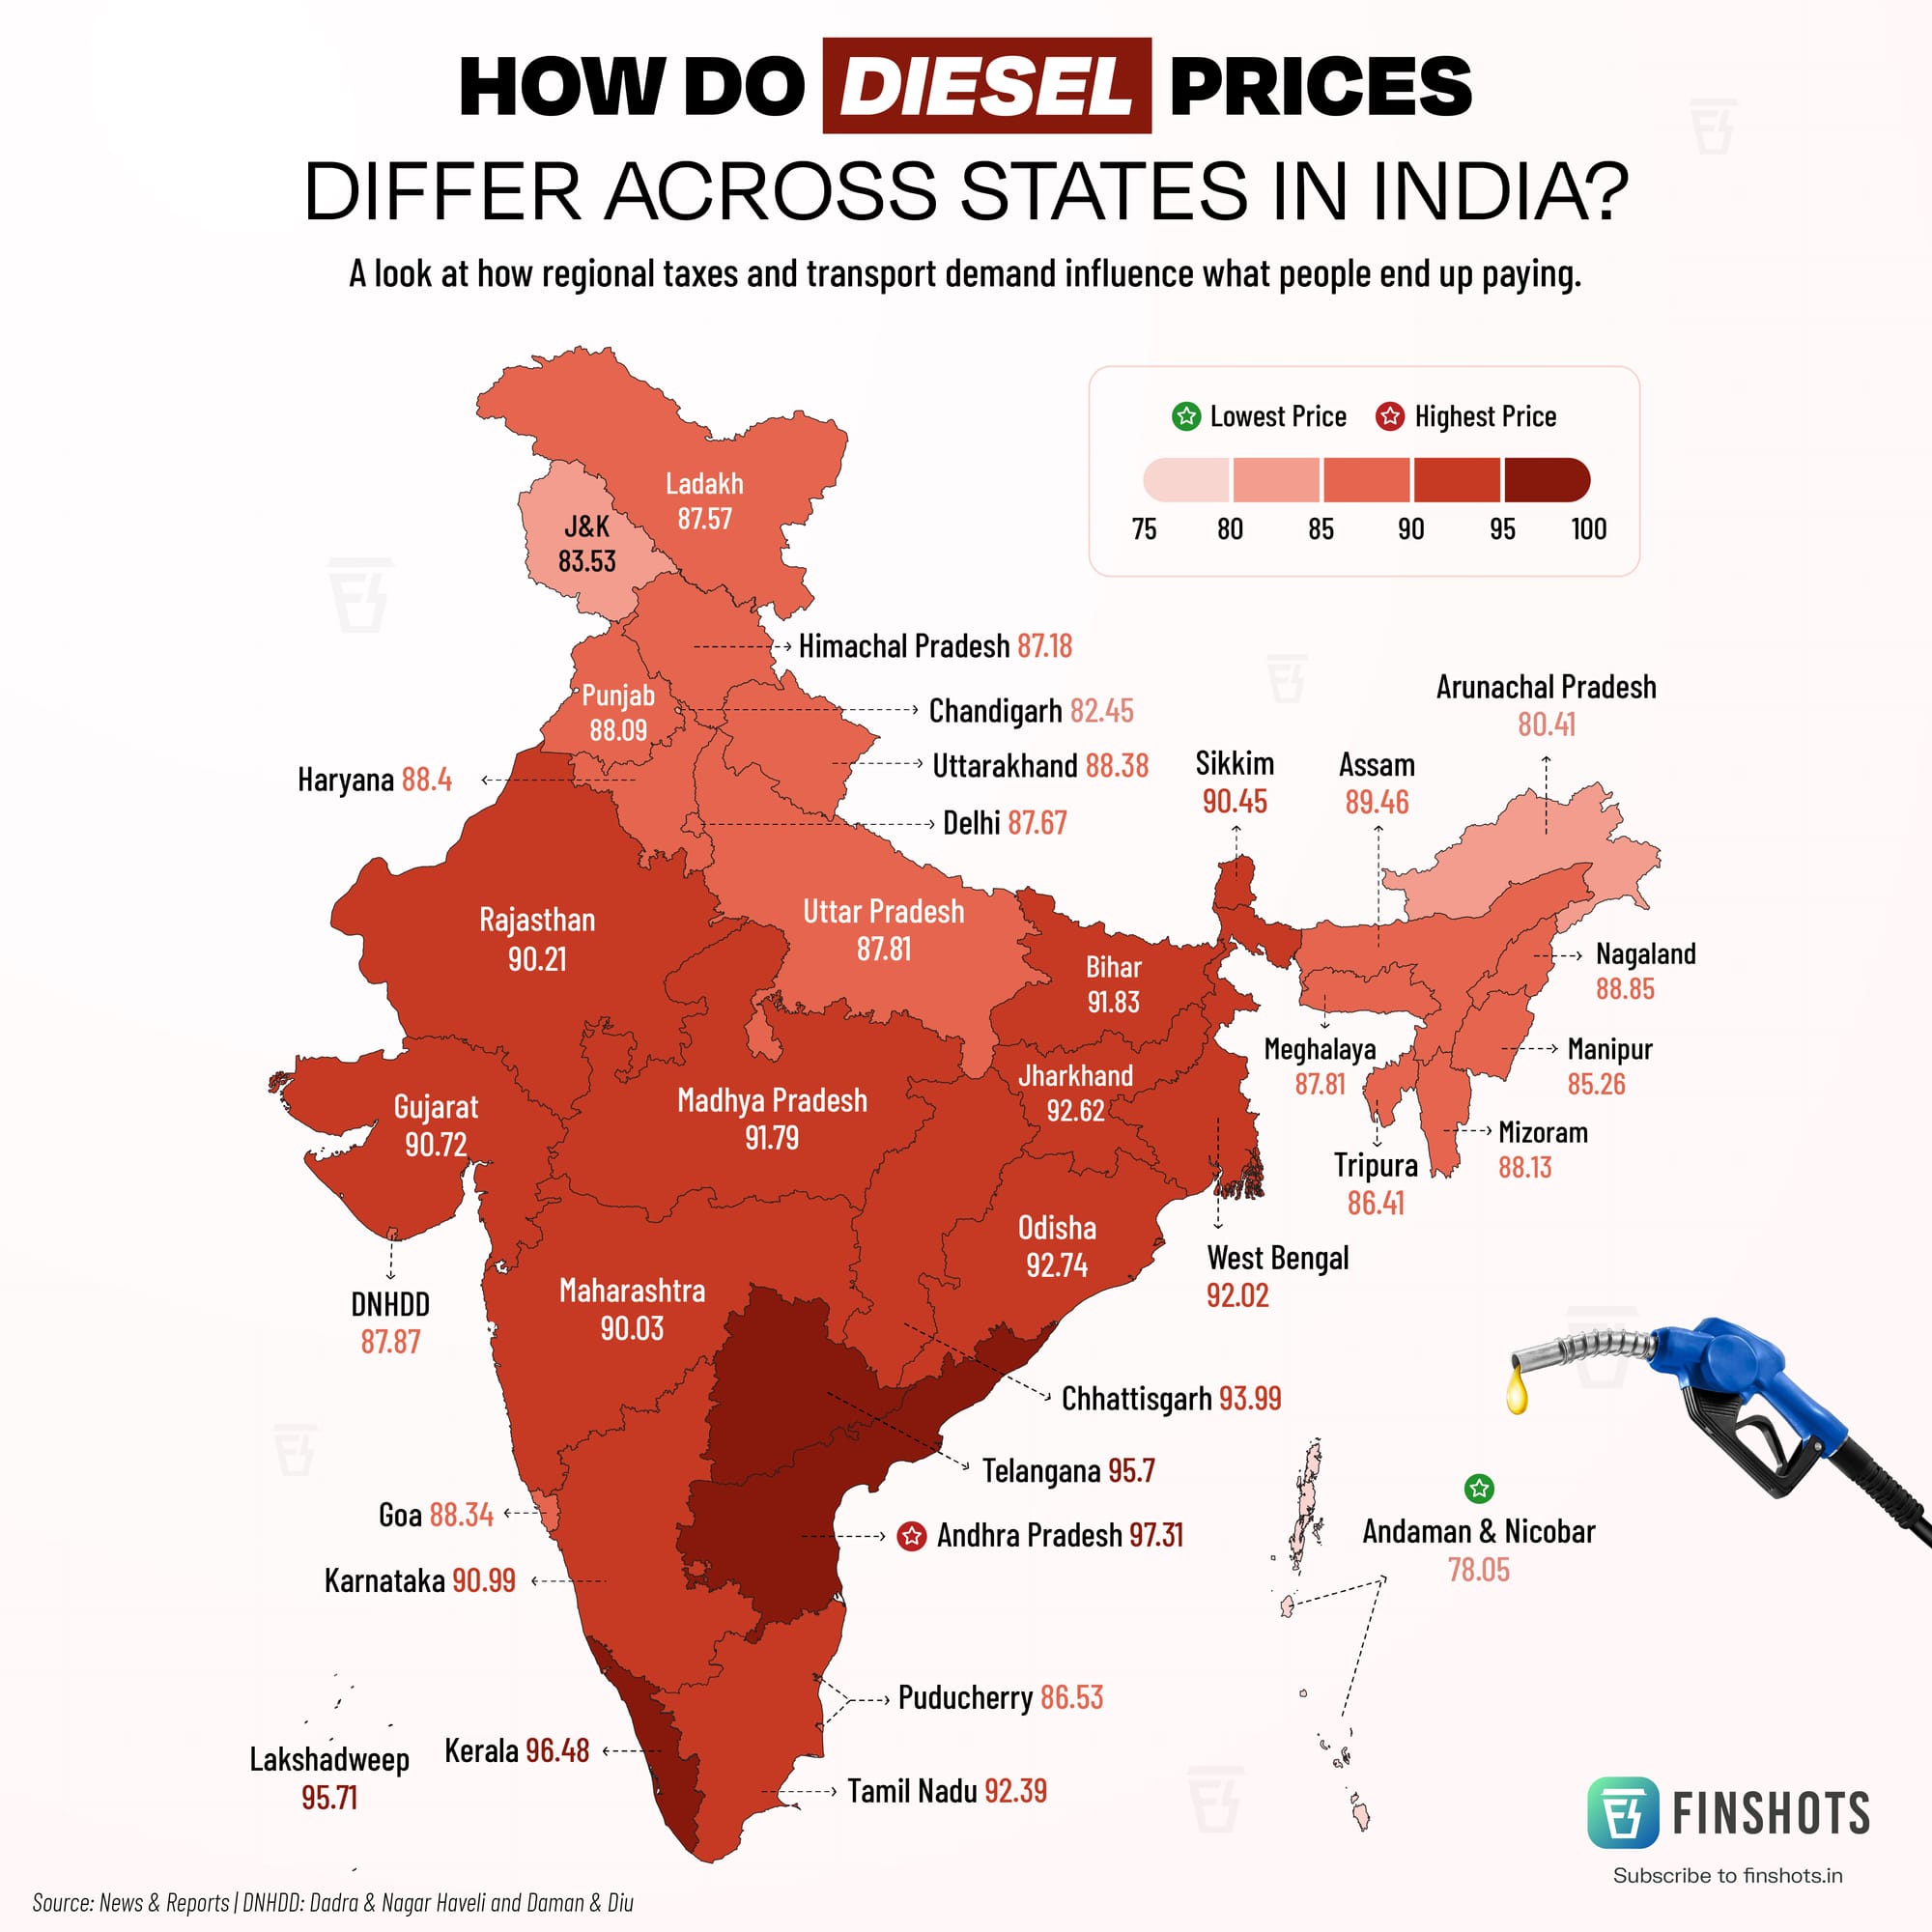
infographic Diesel Prices Across Different States A look at how diesel prices vary across different Indian States.
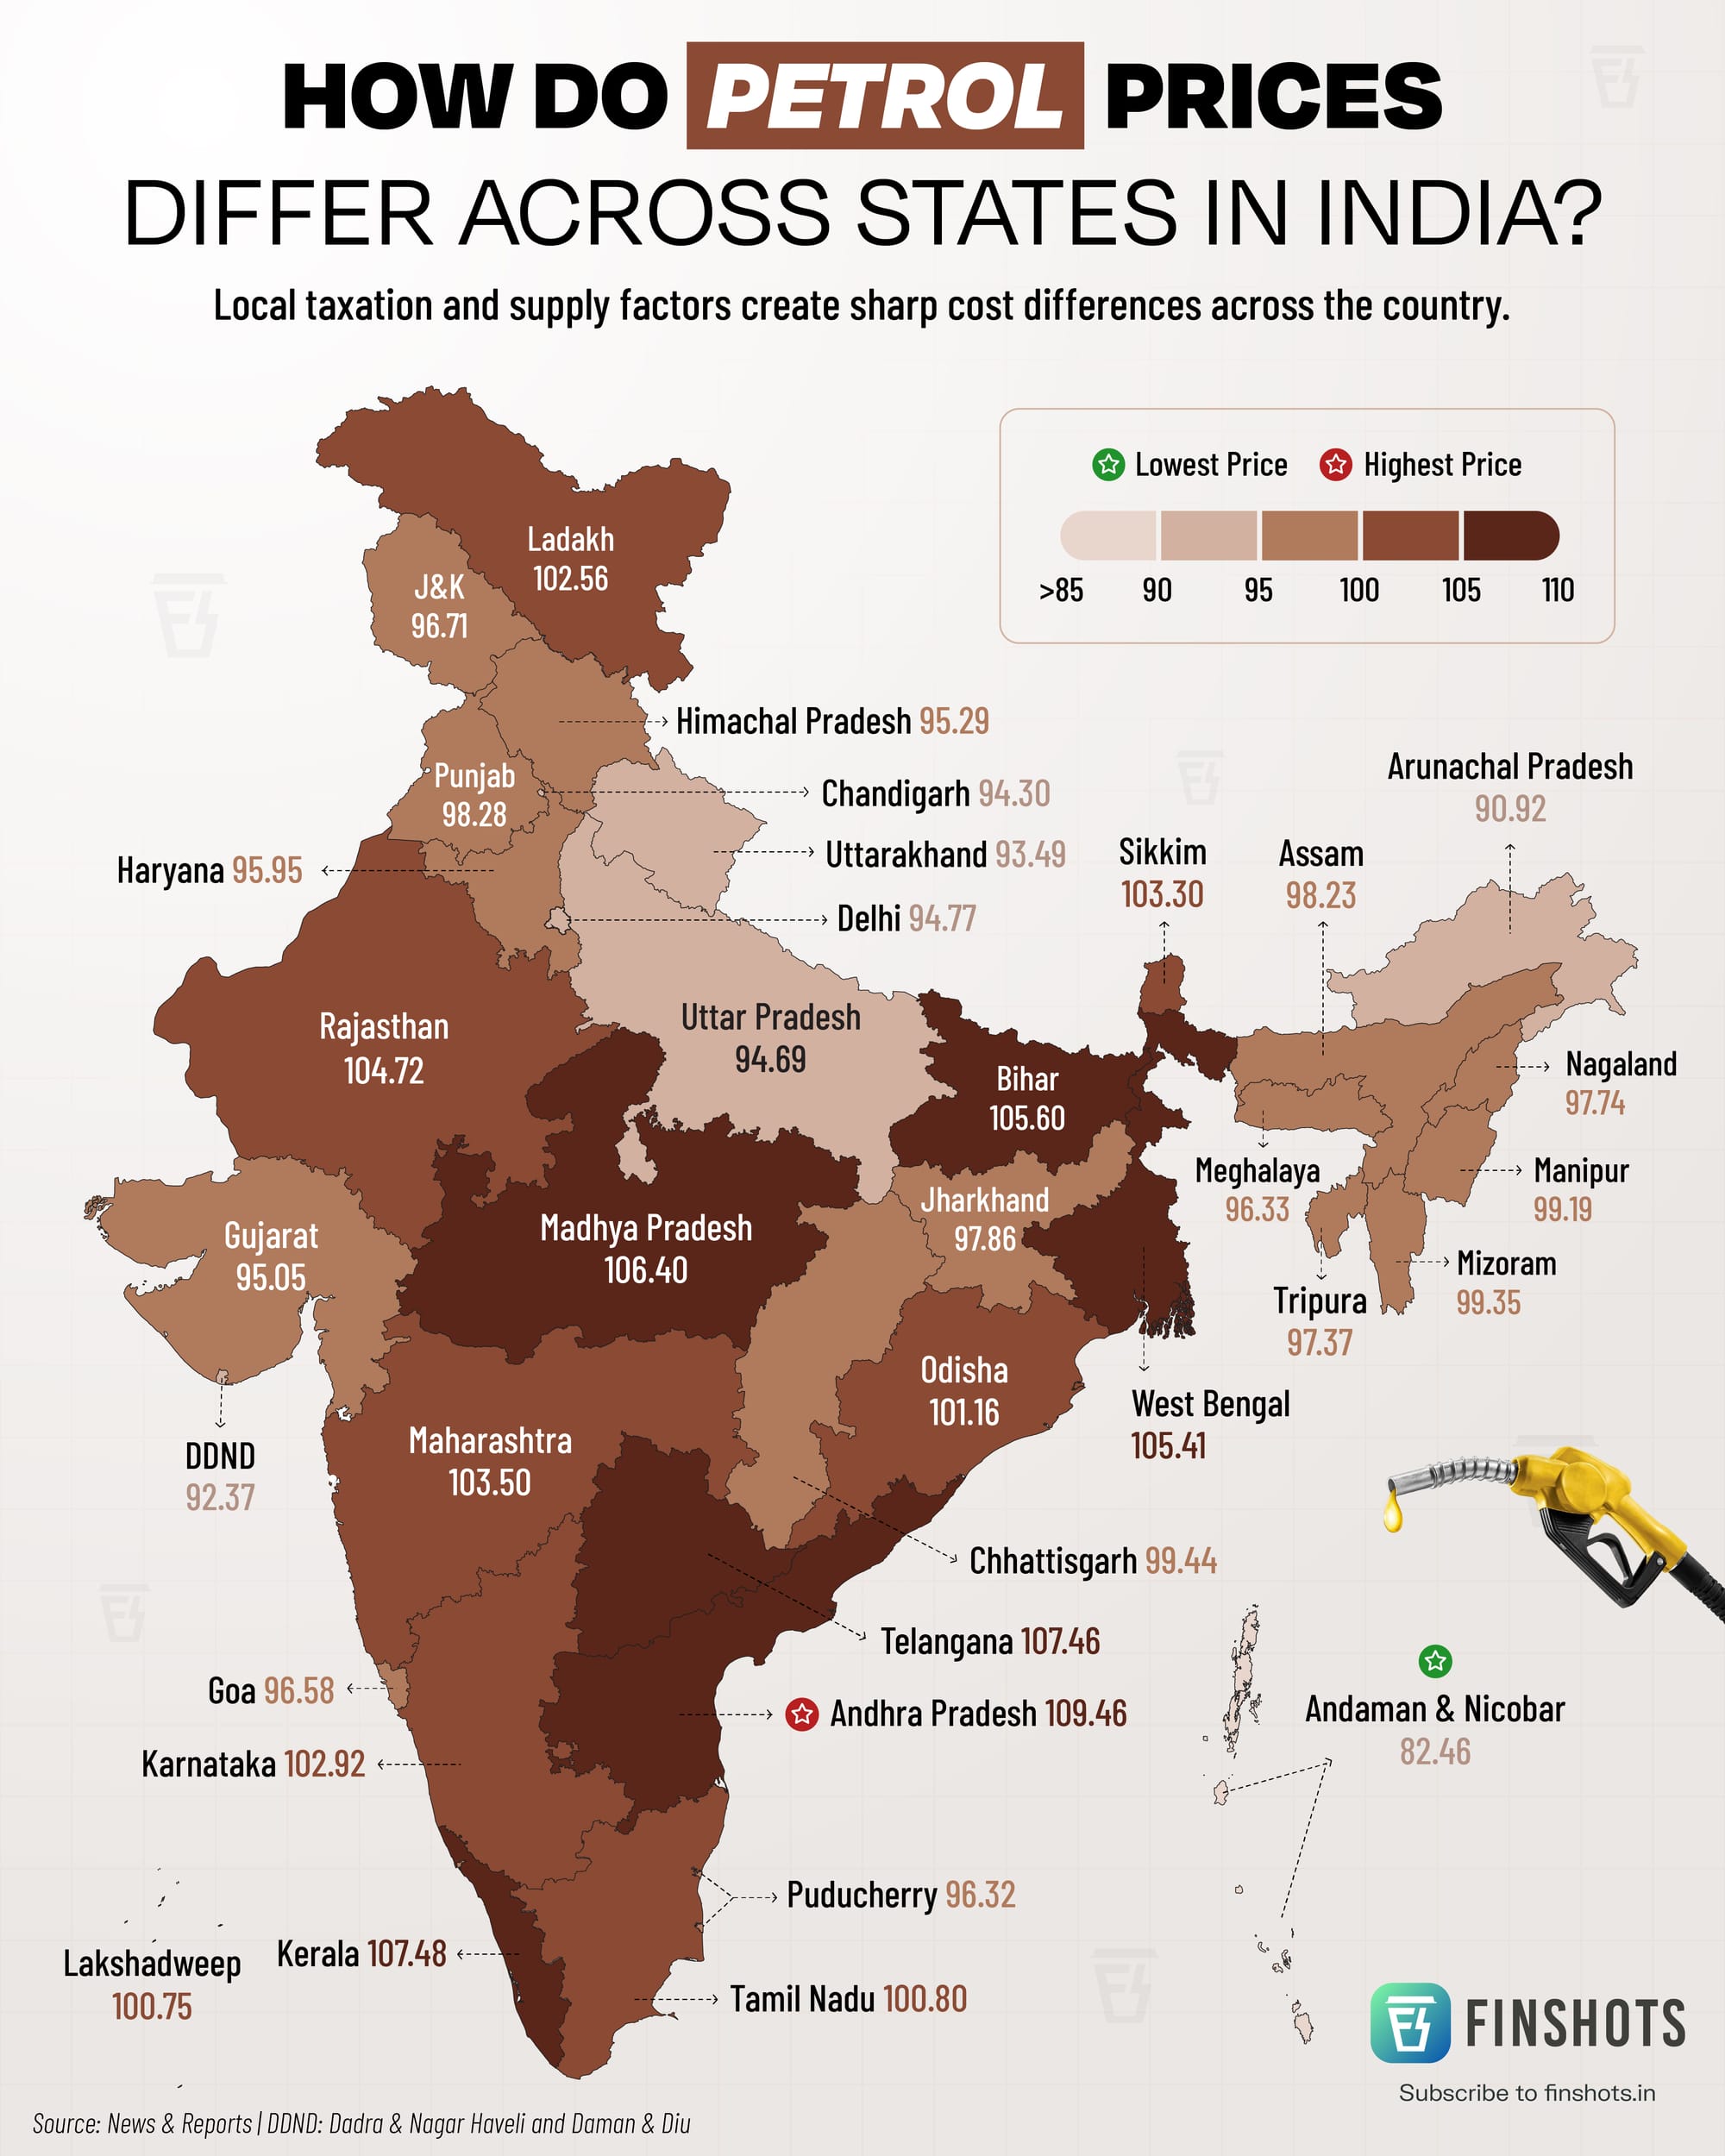
infographic Fuel Prices Across Different States A look at how petrol prices differ across Indian States.
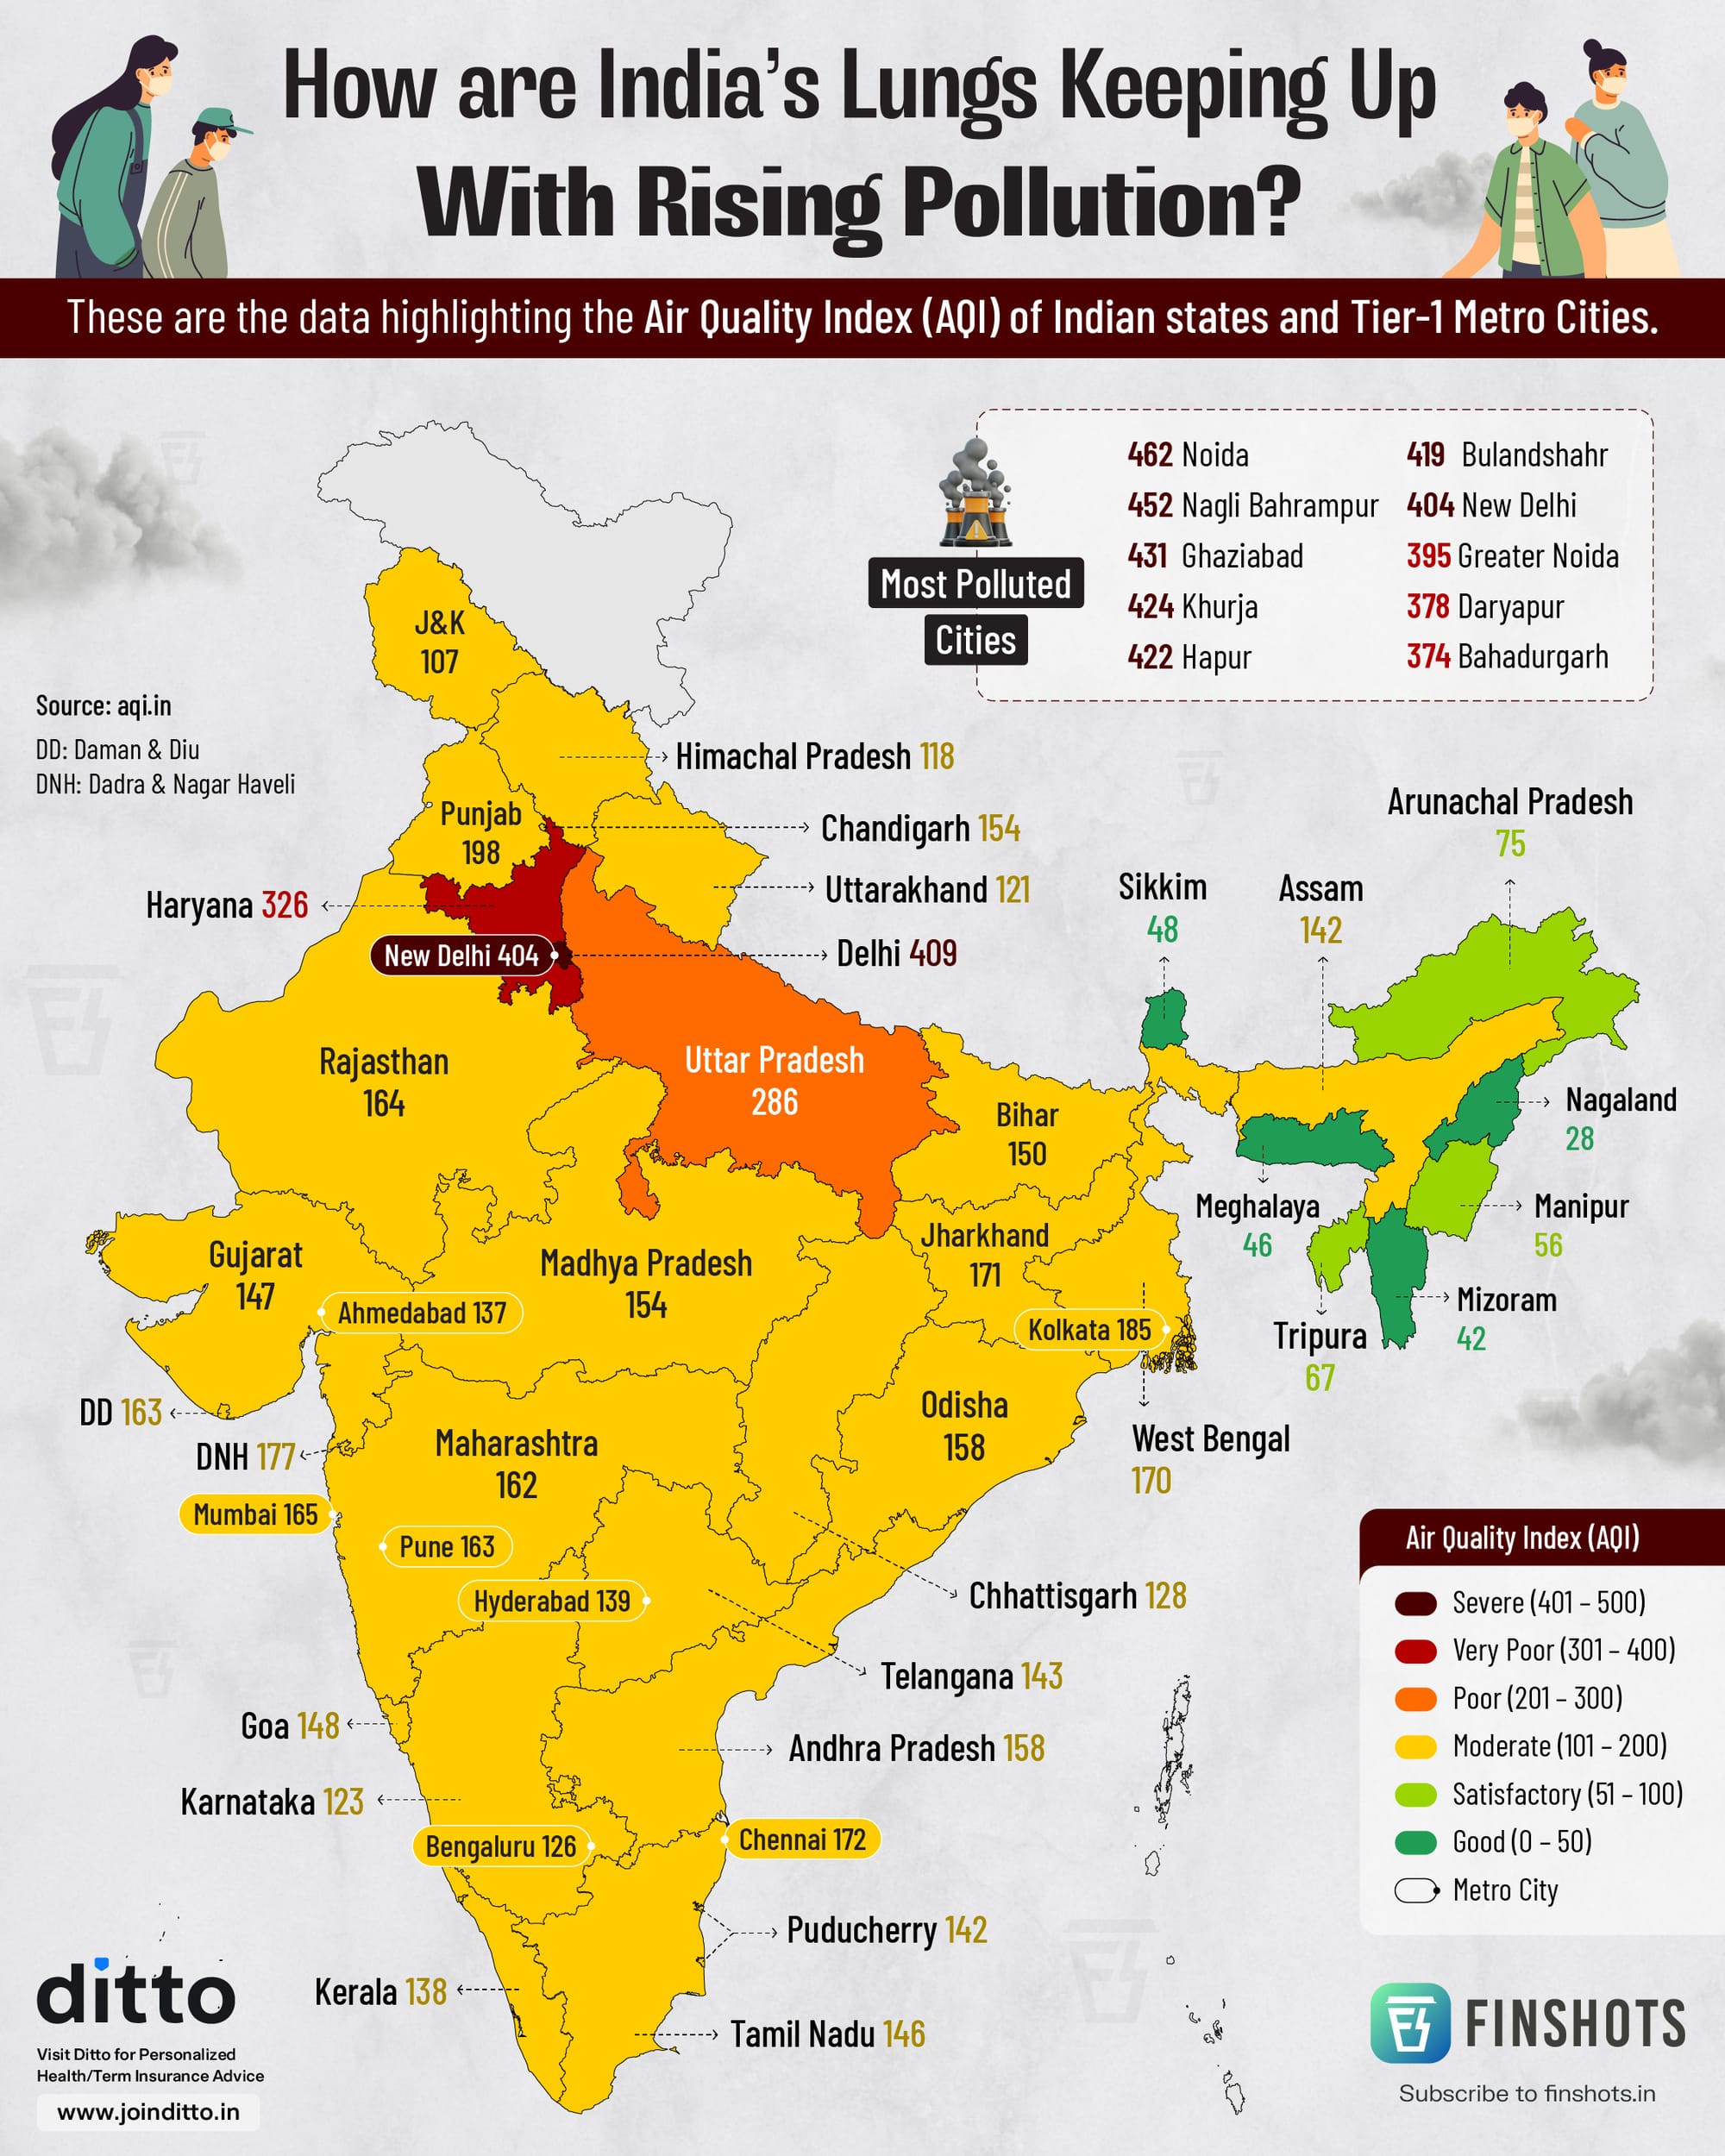
infographic Air Quality Index of Indian States Data highlighting the AQI of Indian states and Tier 1 Metro cities.
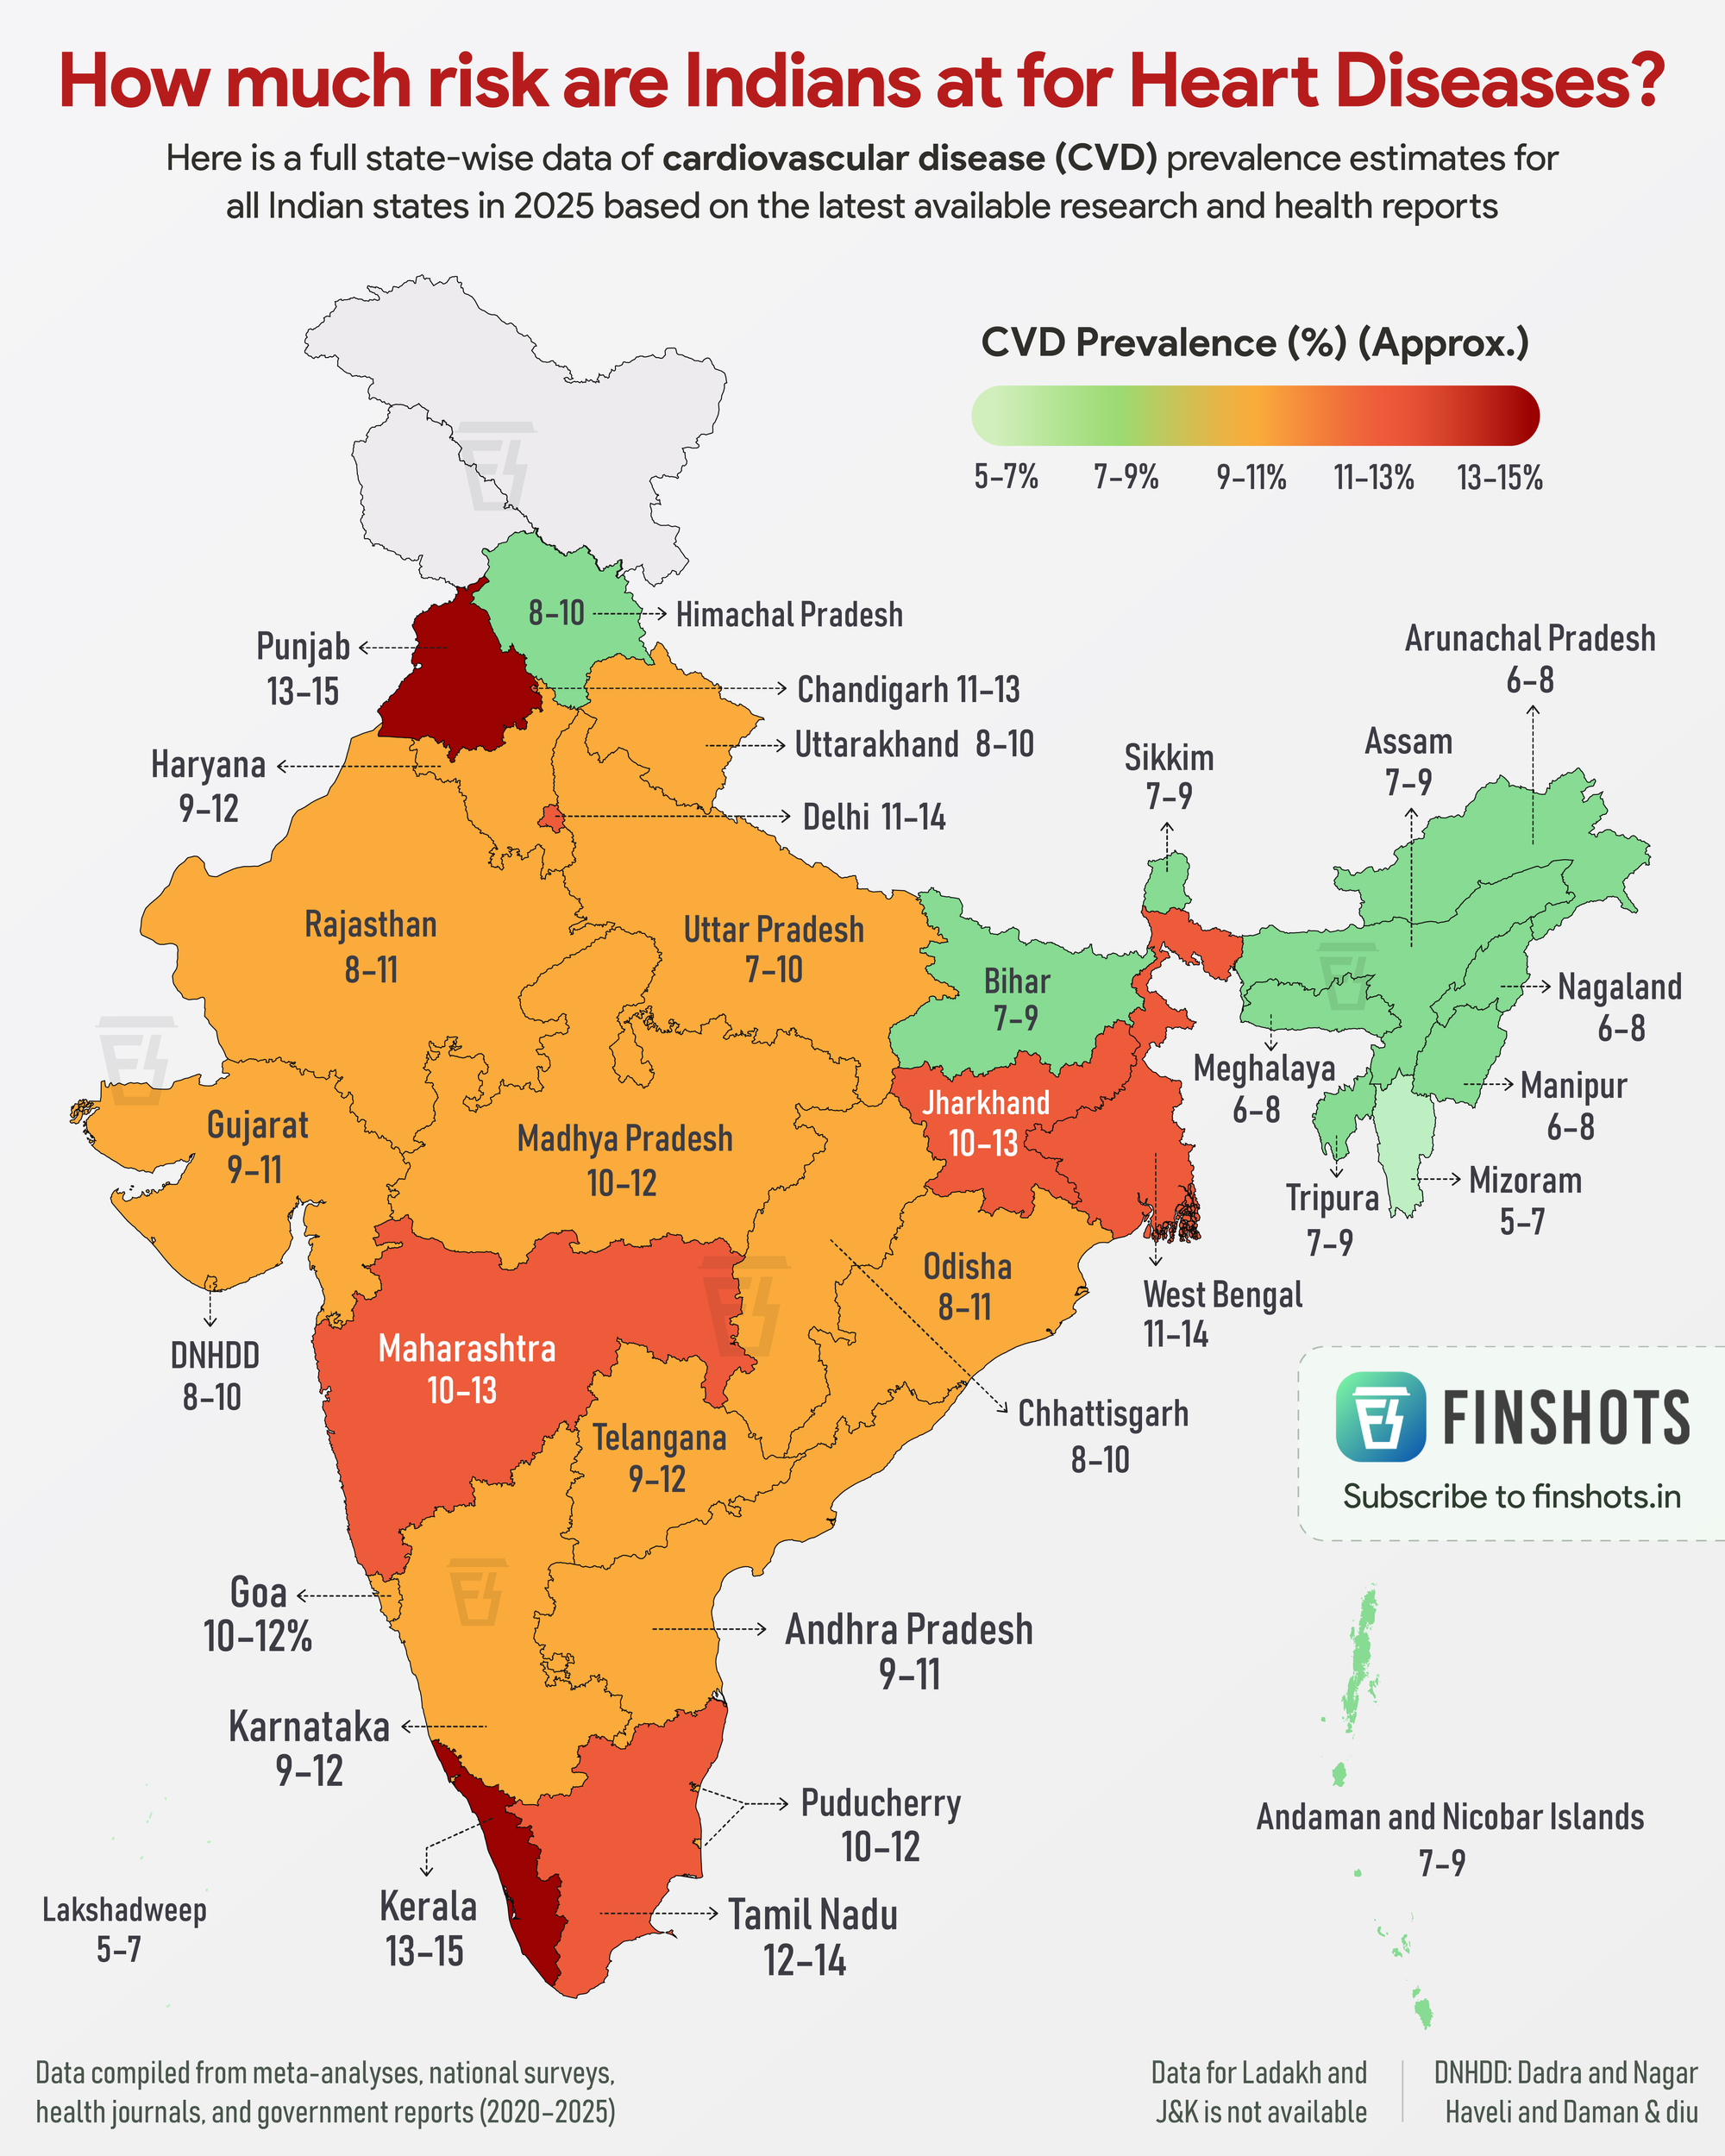
infographic Heart Diseases Prevalence in India A look at state-wise data of cardiovascular diseases prevalence estimates for all Indian states in 2025 based on the latest available research and reports.
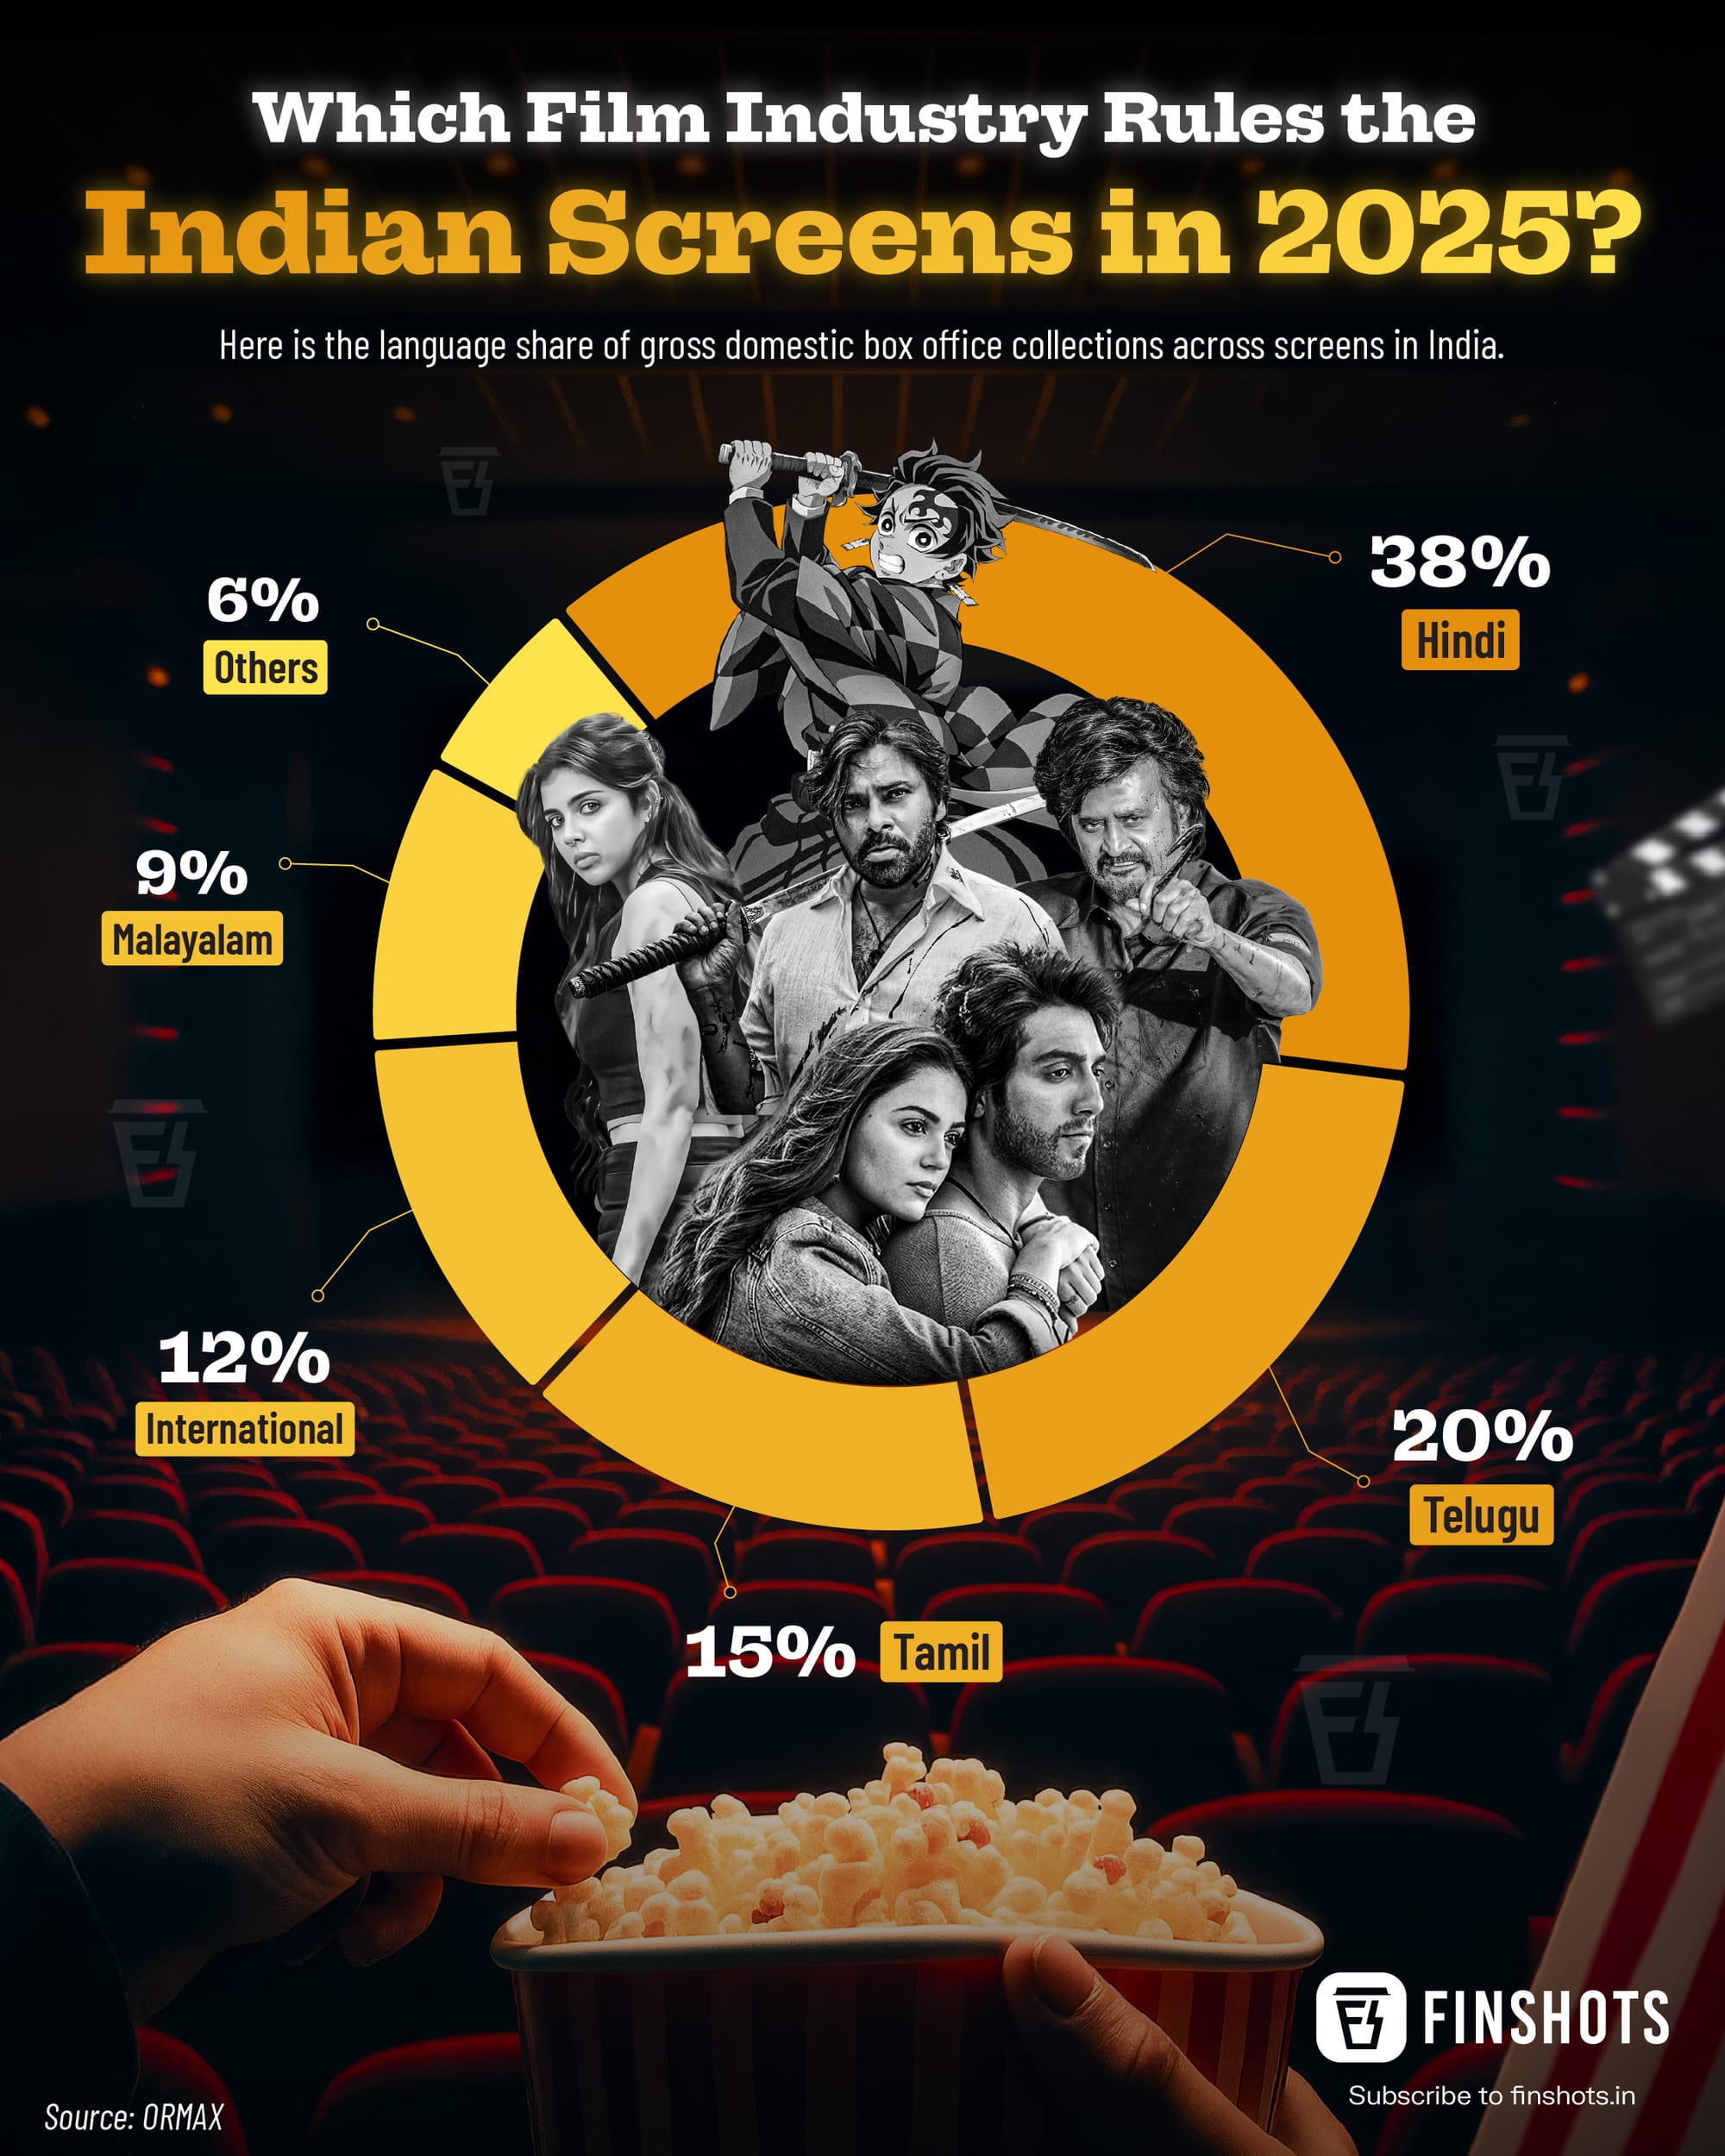
infographic Indian Film Industry Share Language share of gross domestic box office collections across screens in India as of 2025.
infographic State-Wise Diabetic Patients and Rankings An infographic reflecting whether the state's ranking or burden on Diabetes patients increased or decreased during the study period.